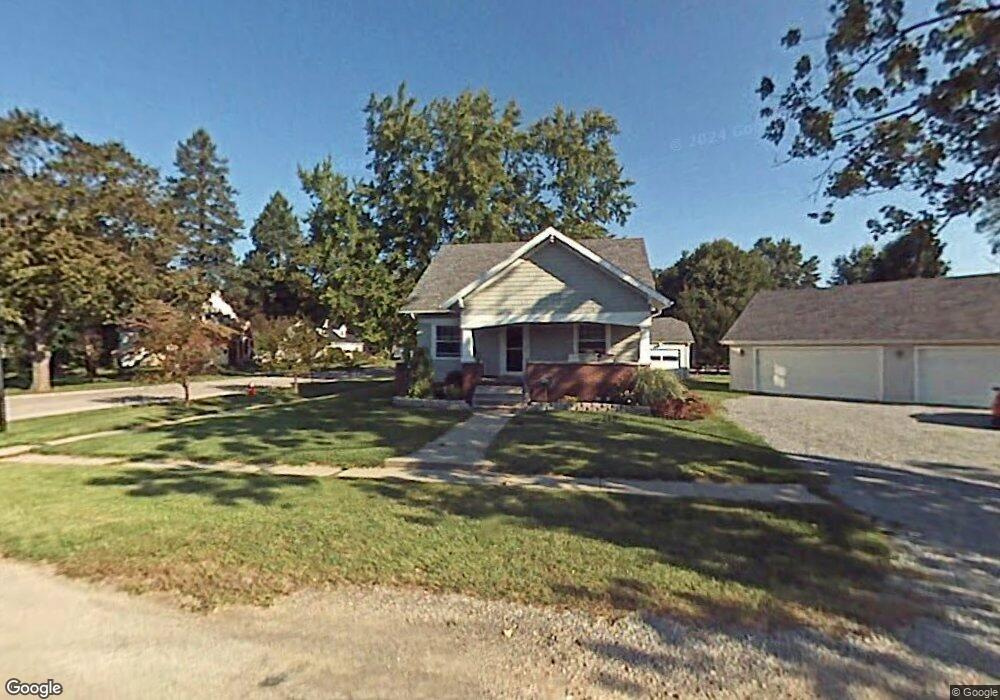
10834 Logan St Whitehouse, OH 43571
West Lucas County NeighborhoodEstimated Value: $239,000 - $277,000
3
Beds
1
Bath
1,362
Sq Ft
$186/Sq Ft
Est. Value
About This Home
This home is located at 10834 Logan St, Whitehouse, OH 43571 and is currently estimated at $253,283, approximately $185 per square foot. 10834 Logan St is a home located in Lucas County with nearby schools including Anthony Wayne High School and Lial Catholic School.
Ownership History
Date
Name
Owned For
Owner Type
Purchase Details
Closed on
Apr 10, 2012
Sold by
Zaleski Rose M
Bought by
Zaleski Rose M and Zaleski Daniel M
Current Estimated Value
Home Financials for this Owner
Home Financials are based on the most recent Mortgage that was taken out on this home.
Original Mortgage
$121,600
Outstanding Balance
$16,455
Interest Rate
3.92%
Mortgage Type
New Conventional
Estimated Equity
$236,829
Purchase Details
Closed on
Aug 24, 2005
Sold by
Clouse Zachary W and Clouse Brooke E
Bought by
Zaleski Rose M
Home Financials for this Owner
Home Financials are based on the most recent Mortgage that was taken out on this home.
Original Mortgage
$112,000
Interest Rate
5.8%
Mortgage Type
Fannie Mae Freddie Mac
Purchase Details
Closed on
Apr 28, 1998
Sold by
Sawicki Walter J and Sawicki Jennie S
Bought by
Clouse Zachary W and Clouse Brooke E
Purchase Details
Closed on
Mar 14, 1998
Sold by
Sawicki Walter J and Sawicki Jennie S
Bought by
Sawicki Walter J and Sawicki Jennie S
Create a Home Valuation Report for This Property
The Home Valuation Report is an in-depth analysis detailing your home's value as well as a comparison with similar homes in the area
Home Values in the Area
Average Home Value in this Area
Purchase History
| Date | Buyer | Sale Price | Title Company |
|---|---|---|---|
| Zaleski Rose M | -- | None Available | |
| Zaleski Rose M | $140,000 | -- | |
| Clouse Zachary W | $103,000 | -- | |
| Sawicki Walter J | -- | -- | |
| Sawicki Walter J | -- | -- |
Source: Public Records
Mortgage History
| Date | Status | Borrower | Loan Amount |
|---|---|---|---|
| Open | Zaleski Rose M | $121,600 | |
| Closed | Zaleski Rose M | $112,000 |
Source: Public Records
Tax History Compared to Growth
Tax History
| Year | Tax Paid | Tax Assessment Tax Assessment Total Assessment is a certain percentage of the fair market value that is determined by local assessors to be the total taxable value of land and additions on the property. | Land | Improvement |
|---|---|---|---|---|
| 2024 | $1,469 | $59,710 | $16,135 | $43,575 |
| 2023 | $2,787 | $51,170 | $13,545 | $37,625 |
| 2022 | $2,814 | $51,170 | $13,545 | $37,625 |
| 2021 | $2,836 | $51,170 | $13,545 | $37,625 |
| 2020 | $2,768 | $44,695 | $11,445 | $33,250 |
| 2019 | $2,763 | $44,695 | $11,445 | $33,250 |
| 2018 | $2,811 | $44,695 | $11,445 | $33,250 |
| 2017 | $2,995 | $45,045 | $11,550 | $33,495 |
| 2016 | $2,979 | $128,700 | $33,000 | $95,700 |
| 2015 | $2,870 | $128,700 | $33,000 | $95,700 |
| 2014 | $2,616 | $44,630 | $11,450 | $33,180 |
| 2013 | $2,616 | $44,630 | $11,450 | $33,180 |
Source: Public Records
Map
Nearby Homes
- 6414 Lenderson Ave
- 6383 Whitehouse Valley Dr
- 6306 Weckerly Rd
- 11149 West St
- 10751 Brexton Ct
- 10700 Brexton Ct
- 10706 Brexton Ct
- 10701 Brexton Ct
- 7008 Queensmark Ln
- 11154 Whitetail Way
- 11158 Whitetail Way
- 6952 Red Stag Ct
- 6746 Oak Crossing Ln
- 11171 Whitetail Way
- 10120 Saddle Bridge Dr N
- 11500 Stiles Rd
- 0 Lot 37 Savanna Lake Blvd
- 0 Lot 36 Savanna Lake Blvd
- 0 Lot 35 Savanna Lake Blvd
- 0 Lot 34 Savanna Lake Blvd
- 6547 Eastview Dr
- 10816 Logan St
- 6541 Eastview Dr
- 6548 Eastview Dr
- 6548 Field Ave
- 6564 Eastview Dr
- 6537 Eastview Dr
- 6542 Field Ave
- 6531 Eastview Dr
- 6540 Eastview Dr
- 6540 Eastview Dr
- 6645 Weckerly Dr
- 6532 Field Ave
- 6538 Eastview Dr
- 6629 Weckerly Dr
- 6703 Gilead St
- 10804 Maumee St
- 6613 Weckerly Dr
- 6522 Field Ave
- 6603 Weckerly Dr