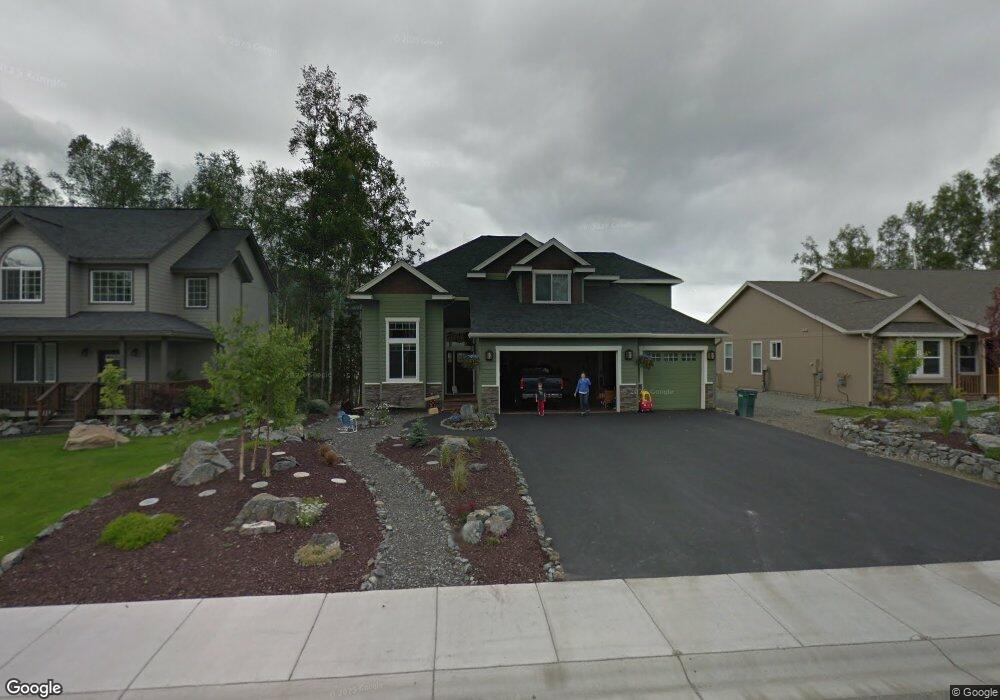
10835 Splendor Loop Eagle River, AK 99577
Eagle River NeighborhoodEstimated Value: $237,000 - $747,000
4
Beds
4
Baths
2,516
Sq Ft
$219/Sq Ft
Est. Value
About This Home
This home is located at 10835 Splendor Loop, Eagle River, AK 99577 and is currently estimated at $551,248, approximately $219 per square foot. 10835 Splendor Loop is a home located in Anchorage Municipality with nearby schools including Eagle River Elementary School, Gruening Middle School, and Chugiak High School.
Ownership History
Date
Name
Owned For
Owner Type
Purchase Details
Closed on
Jul 20, 2009
Sold by
Troy Davis Homes Inc
Bought by
Wotring Brian J and Wotring Kaleigh S
Current Estimated Value
Home Financials for this Owner
Home Financials are based on the most recent Mortgage that was taken out on this home.
Original Mortgage
$400,638
Outstanding Balance
$265,177
Interest Rate
5.59%
Mortgage Type
New Conventional
Estimated Equity
$286,071
Purchase Details
Closed on
Jul 28, 2007
Sold by
Nelson Stuart A and Nelson Barbara S
Bought by
American Intl Relocation Solutions Llc
Purchase Details
Closed on
Dec 15, 2005
Sold by
Horseshoe Properties Llc
Bought by
Wallace Homes Llc
Home Financials for this Owner
Home Financials are based on the most recent Mortgage that was taken out on this home.
Original Mortgage
$329,250
Interest Rate
6.31%
Mortgage Type
Construction
Create a Home Valuation Report for This Property
The Home Valuation Report is an in-depth analysis detailing your home's value as well as a comparison with similar homes in the area
Home Values in the Area
Average Home Value in this Area
Purchase History
| Date | Buyer | Sale Price | Title Company |
|---|---|---|---|
| Wotring Brian J | -- | Stewart | |
| American Intl Relocation Solutions Llc | -- | None Available | |
| Wallace Homes Llc | -- | Mat Su Title Ins Agency Inc |
Source: Public Records
Mortgage History
| Date | Status | Borrower | Loan Amount |
|---|---|---|---|
| Open | Wotring Brian J | $400,638 | |
| Previous Owner | Wallace Homes Llc | $329,250 |
Source: Public Records
Tax History
| Year | Tax Paid | Tax Assessment Tax Assessment Total Assessment is a certain percentage of the fair market value that is determined by local assessors to be the total taxable value of land and additions on the property. | Land | Improvement |
|---|---|---|---|---|
| 2025 | $8,394 | $621,900 | $143,200 | $478,700 |
| 2024 | $8,394 | $594,100 | $126,500 | $467,600 |
| 2023 | $9,076 | $545,100 | $121,300 | $423,800 |
| 2022 | $7,924 | $524,800 | $115,300 | $409,500 |
| 2021 | $8,653 | $486,400 | $115,300 | $371,100 |
| 2020 | $6,742 | $474,300 | $115,300 | $359,000 |
| 2019 | $6,926 | $474,400 | $115,300 | $359,100 |
| 2018 | $6,866 | $474,600 | $115,300 | $359,300 |
| 2017 | $7,344 | $478,400 | $115,300 | $363,100 |
| 2016 | $6,382 | $473,400 | $112,200 | $361,200 |
| 2015 | $6,382 | $455,100 | $112,200 | $342,900 |
| 2014 | $6,382 | $448,100 | $101,200 | $346,900 |
Source: Public Records
Map
Nearby Homes
- 10857 Splendor Loop
- 16941 Vanover Cir
- 17354 Kantishna Dr
- 17527 Baronoff Ave
- 17645 Meadow Creek Dr
- 17723 Chilkat Ct
- 16223 Rebischke Ln
- 16000 Domain Ln
- 11288 Wood River Way Unit 6
- 10204 Eagle View Dr
- 16840 Park Place St
- 11301 Bridger Cir
- 11713 Galloway Loop Unit 5
- 17715 Nitoanya Cir
- 17727 Nitoanya Cir
- 11726 Galloway Loop Unit 25
- 11834 Galloway Loop Unit 47
- L13 Sasquatch Cir
- 9502 Dinaaka Cir
- 12121 Horseshoe Dr
- 10823 Splendor Loop
- 10845 Splendor Loop
- 10777 Edgewood Cir
- 10763 Edgewood Cir
- 10811 Splendor Loop
- 10762 Edgewood Cir
- 10862 Splendor Loop
- 10834 Splendor Loop
- 10822 Splendor Loop
- L12 B2 Edgewood Cir
- L16 B2 Edgewood Cir
- L3 B3 Edgewood Cir
- 10801 Splendor Loop
- 10751 Edgewood Cir
- L19 B1 Splender Loop
- 17145 Hideaway Ridge Dr
- 10810 Splendor Loop
- 10750 Edgewood Cir
- 10871 Splendor Loop
- 10727 Briggs Cache Cir
Your Personal Tour Guide
Ask me questions while you tour the home.