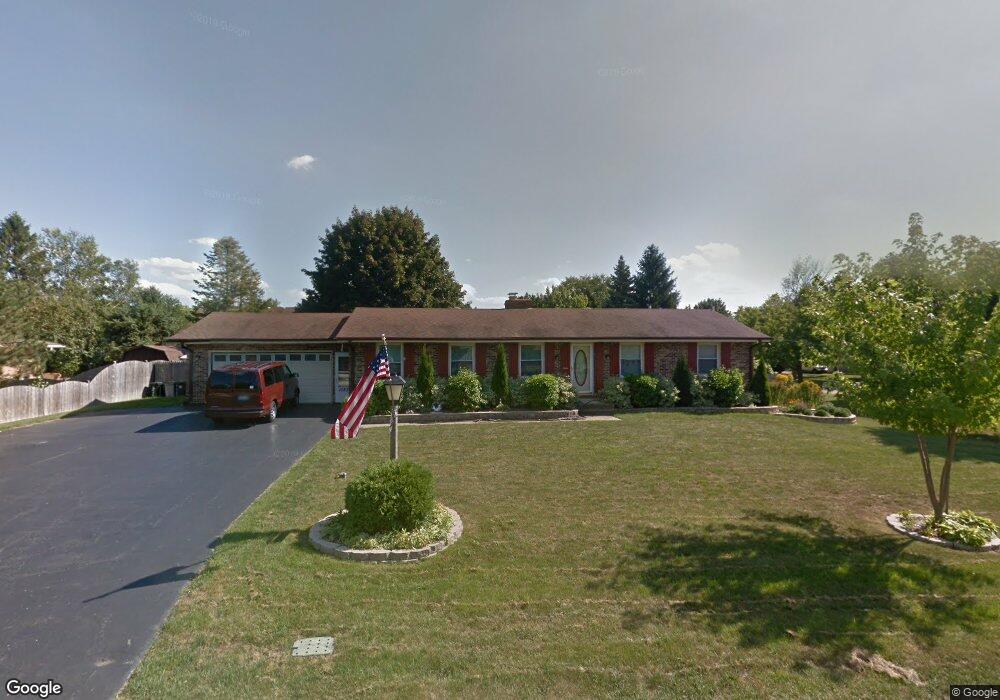
10839 W Fairbanks Ave Beach Park, IL 60099
Estimated Value: $307,000 - $388,000
--
Bed
2
Baths
1,568
Sq Ft
$214/Sq Ft
Est. Value
About This Home
This home is located at 10839 W Fairbanks Ave, Beach Park, IL 60099 and is currently estimated at $335,360, approximately $213 per square foot. 10839 W Fairbanks Ave is a home located in Lake County with nearby schools including Howe Elementary School, Beach Park Middle School, and Zion-Benton Township High School.
Ownership History
Date
Name
Owned For
Owner Type
Purchase Details
Closed on
Dec 11, 2024
Sold by
Rivelli Jeffrey J and Rivelli Wanda J
Bought by
Jeffrey J Rivelli Revocable Trust and Wanda J Rivelli Revocable Trust
Current Estimated Value
Purchase Details
Closed on
Jan 30, 2002
Sold by
Rivelli Jeffrey J and Rivelli Wanda J
Bought by
Rivelli Jeffrey J and Rivelli Wanda J
Home Financials for this Owner
Home Financials are based on the most recent Mortgage that was taken out on this home.
Original Mortgage
$142,400
Interest Rate
7.03%
Purchase Details
Closed on
Jan 26, 1999
Sold by
Madden James J
Bought by
Rivelli Jeffrey J
Home Financials for this Owner
Home Financials are based on the most recent Mortgage that was taken out on this home.
Original Mortgage
$130,573
Interest Rate
7.15%
Mortgage Type
FHA
Create a Home Valuation Report for This Property
The Home Valuation Report is an in-depth analysis detailing your home's value as well as a comparison with similar homes in the area
Home Values in the Area
Average Home Value in this Area
Purchase History
| Date | Buyer | Sale Price | Title Company |
|---|---|---|---|
| Jeffrey J Rivelli Revocable Trust | -- | None Listed On Document | |
| Jeffrey J Rivelli Revocable Trust | -- | None Listed On Document | |
| Rivelli Jeffrey J | -- | -- | |
| Rivelli Jeffrey J | $131,500 | -- |
Source: Public Records
Mortgage History
| Date | Status | Borrower | Loan Amount |
|---|---|---|---|
| Previous Owner | Rivelli Jeffrey J | $142,400 | |
| Previous Owner | Rivelli Jeffrey J | $130,573 |
Source: Public Records
Tax History Compared to Growth
Tax History
| Year | Tax Paid | Tax Assessment Tax Assessment Total Assessment is a certain percentage of the fair market value that is determined by local assessors to be the total taxable value of land and additions on the property. | Land | Improvement |
|---|---|---|---|---|
| 2024 | $7,882 | $91,920 | $9,921 | $81,999 |
| 2023 | $7,544 | $81,926 | $9,577 | $72,349 |
| 2022 | $7,544 | $75,770 | $9,356 | $66,414 |
| 2021 | $6,339 | $61,315 | $9,118 | $52,197 |
| 2020 | $6,204 | $58,512 | $8,701 | $49,811 |
| 2019 | $6,176 | $55,514 | $8,255 | $47,259 |
| 2018 | $6,335 | $55,059 | $10,034 | $45,025 |
| 2017 | $6,278 | $51,796 | $9,439 | $42,357 |
| 2016 | $6,104 | $49,311 | $8,986 | $40,325 |
| 2015 | $5,903 | $45,223 | $8,241 | $36,982 |
| 2014 | $6,127 | $49,762 | $10,587 | $39,175 |
| 2012 | $6,184 | $51,712 | $11,002 | $40,710 |
Source: Public Records
Map
Nearby Homes
- 10765 W Liberty Ave
- 1121 Otto Graham Ln
- 3931 Bertrand Ln
- 38571 N Cedar Ave
- 11345 W Carnahan Ave
- 11382 W Leland Ave
- 10295 W Crissy Ave
- 3224 Gilboa Ave
- 3225 Gilead Ave
- 39161 N Holdridge Ave
- 3221 Gideon Ave
- 11342-11346 W Wadsworth Rd
- 10205 W Ames Ave
- 38683 N Lewis Ave
- 10209 W Crissy Ave
- 1667 W Beach Rd Unit 1667
- 1677 W Beach Rd Unit 1677
- 2614 33rd St
- 10133 W Wadsworth Rd
- 1730 W Beach Rd
- 10853 W Fairbanks Ave
- 10844 W Pickford Ave
- 10852 W Pickford Ave
- 10816 W Pickford Ave
- 10844 W Fairbanks Ave
- 10852 W Fairbanks Ave
- 10816 W Fairbanks Ave
- 10787 W Fairbanks Ave
- 10788 W Pickford Ave
- 4119 Bertrand Ln
- 4115 Bertrand Ln
- 4123 Bertrand Ln
- 1109 Bank Ln
- 10839 W Pickford Ave
- 10853 W Liberty Ave
- 10811 W Liberty Ave
- 1105 Bank Ln
- 4109 Bertrand Ln
- 4127 Bertrand Ln