Estimated Value: $163,923 - $217,000
--
Bed
2
Baths
1,488
Sq Ft
$129/Sq Ft
Est. Value
About This Home
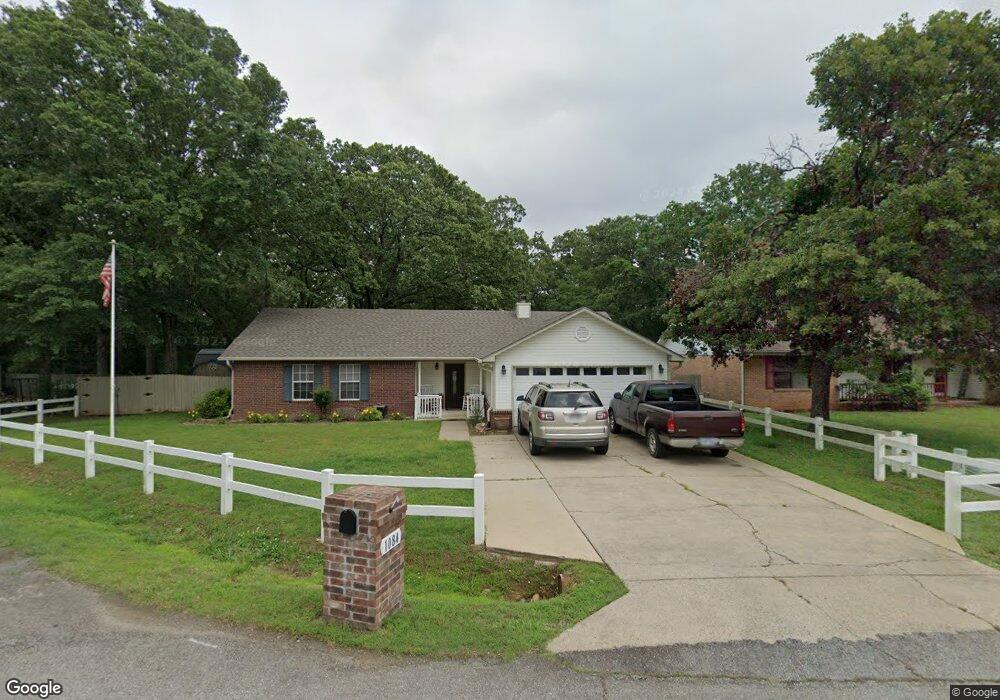
This home is located at 1084 Highland Blvd, Cabot, AR 72023 and is currently estimated at $191,731, approximately $128 per square foot. 1084 Highland Blvd is a home located in Lonoke County with nearby schools including Mountain Springs Elementary School, Cabot Middle School North, and Cabot Junior High North.
Ownership History
Date
Name
Owned For
Owner Type
Purchase Details
Closed on
Dec 22, 2017
Sold by
Loughlin John E and Loughlin Rebecca R
Bought by
Loughlin John E and Loughlin Rebecca R
Current Estimated Value
Purchase Details
Closed on
Sep 2, 2015
Sold by
Loughlin Jo Ann
Bought by
Loughlin John E
Purchase Details
Closed on
Aug 17, 2011
Sold by
Loughlin John E
Bought by
Loughlin John E and Loughlin Joann B
Purchase Details
Closed on
Jul 27, 2011
Sold by
Loughlin John E
Bought by
Loughlin John E and Loughlin Joann B
Purchase Details
Closed on
Apr 22, 2005
Bought by
Loughlin
Purchase Details
Closed on
Apr 13, 2005
Bought by
Loughlin
Purchase Details
Closed on
Dec 4, 1997
Bought by
Gulbrantson
Purchase Details
Closed on
Mar 19, 1996
Bought by
Clayton
Purchase Details
Closed on
Jul 3, 1995
Bought by
Temco Const
Purchase Details
Closed on
Jan 4, 1994
Bought by
Sunrise Deve
Create a Home Valuation Report for This Property
The Home Valuation Report is an in-depth analysis detailing your home's value as well as a comparison with similar homes in the area
Home Values in the Area
Average Home Value in this Area
Purchase History
| Date | Buyer | Sale Price | Title Company |
|---|---|---|---|
| Loughlin John E | -- | None Available | |
| Loughlin John E | -- | None Available | |
| Loughlin John E | -- | -- | |
| Loughlin John E | -- | -- | |
| Loughlin | $110,000 | -- | |
| Loughlin | $110,000 | -- | |
| Gulbrantson | -- | -- | |
| Gulbrantson | $91,000 | -- | |
| Clayton | $85,000 | -- | |
| Temco Const | $11,000 | -- | |
| Sunrise Deve | -- | -- |
Source: Public Records
Tax History Compared to Growth
Tax History
| Year | Tax Paid | Tax Assessment Tax Assessment Total Assessment is a certain percentage of the fair market value that is determined by local assessors to be the total taxable value of land and additions on the property. | Land | Improvement |
|---|---|---|---|---|
| 2025 | $691 | $24,520 | $3,000 | $21,520 |
| 2024 | $691 | $24,520 | $3,000 | $21,520 |
| 2023 | $691 | $24,520 | $3,000 | $21,520 |
| 2022 | $741 | $24,520 | $3,000 | $21,520 |
| 2021 | $741 | $24,520 | $3,000 | $21,520 |
| 2020 | $741 | $23,030 | $3,000 | $20,030 |
| 2019 | $741 | $23,030 | $3,000 | $20,030 |
| 2018 | $733 | $23,030 | $3,000 | $20,030 |
| 2017 | $1,007 | $23,030 | $3,000 | $20,030 |
| 2016 | $733 | $23,030 | $3,000 | $20,030 |
| 2015 | $1,007 | $24,020 | $3,000 | $21,020 |
| 2014 | $733 | $24,020 | $3,000 | $21,020 |
Source: Public Records
Map
Nearby Homes
- 16 Cabot Cove
- 2032 N Hills Dr
- 1070 Highland Blvd
- 391 Briarwood Loop
- 2013 N Hills Dr
- 105 Epperson Dr
- 1030 Golden Hills Dr
- Lot 4 Knifechief Cove
- 0 Willie Ray Dr Unit 25004499
- Lot 3 Knifechief Cove
- Lot 13 Pawnee Dr
- 30 Echohawk Ln
- 1017 Southhills Dr
- 141 Birchwood Cir
- 138 Birchwood Cir
- 311 Mountain Springs Rd
- 17 Woodhaven Dr
- 05 Bradford Dr
- 02 Bradford Dr
- 04 Bradford Dr
- 1082 Highland Blvd
- 0 Cabot Cove
- 6 Cabot Cove
- 000 Cabot Cove
- 0 Highway 107 Tract 1
- 1080 Highland Blvd
- 1083 Highland Blvd
- 0 Highway 107 Tract 3
- 0 Highway 107 Tract 2
- 10 Cabot Cove
- 1081 Highland Blvd
- 1078 Highland Blvd
- 13 Opie Ct
- 8 Cabot Cove
- 6 Cabot Cove
- 18 Cabot Cove
- 13 Cabot Cove
- 12 Cabot Cove
- 1079 Highland Blvd
- 1076 Highland Blvd