Estimated Value: $342,000 - $442,000
About This Home
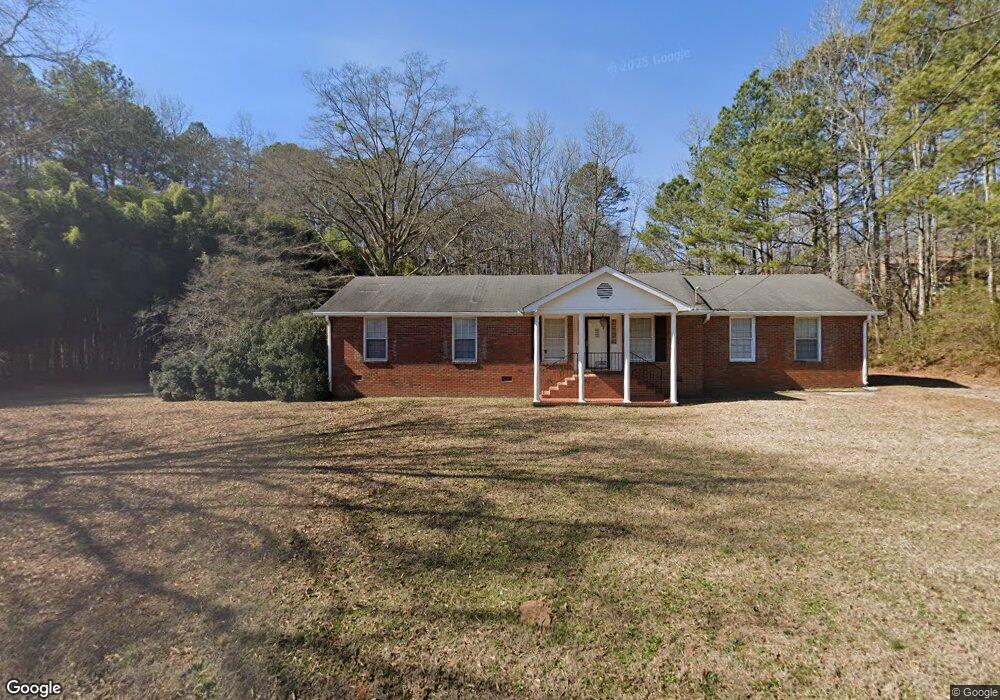
This home is located at 1084 Mathis Rd SE, Rome, GA 30161 and is currently estimated at $384,996, approximately $186 per square foot. 1084 Mathis Rd SE is a home with nearby schools including Pepperell Middle School and Pepperell High School.
Ownership History
We collect this data history from publicly available records. To have your information removed, we recommend requesting removal directly through your county’s website.
Purchase Details
Home Financials for this Owner
Home Financials are based on the most recent Mortgage that was taken out on this home.Purchase Details
Home Financials for this Owner
Home Financials are based on the most recent Mortgage that was taken out on this home.Purchase Details
Purchase Details
Purchase Details
Purchase Details
Home Values in the Area
Average Home Value in this Area
Purchase History
We collect this data history from publicly available records. To have your information removed, we recommend requesting removal directly through your county’s website.
| Date | Buyer | Sale Price | Title Company |
|---|---|---|---|
| $230,000 | -- | ||
| -- | -- | ||
| -- | -- | ||
| -- | -- | ||
| -- | -- | ||
| -- | -- | ||
| -- | -- | ||
| -- | -- |
Mortgage History
We collect this data history from publicly available records. To have your information removed, we recommend requesting removal directly through your county’s website.
| Date | Status | Borrower | Loan Amount |
|---|---|---|---|
| Open | $160,000 | ||
| Closed | $160,000 |
Tax History
We collect this data history from publicly available records. To have your information removed, we recommend requesting removal directly through your county’s website.
| Year | Tax Paid | Tax Assessment Tax Assessment Total Assessment is a certain percentage of the fair market value that is determined by local assessors to be the total taxable value of land and additions on the property. | Land | Improvement |
|---|---|---|---|---|
| 2025 | $2,348 | $137,278 | $64,716 | $72,562 |
| 2024 | $2,348 | $125,571 | $57,526 | $68,045 |
| 2023 | $2,201 | $125,050 | $52,296 | $72,754 |
| 2022 | $2,001 | $103,342 | $43,580 | $59,762 |
| 2021 | $1,666 | $87,199 | $39,318 | $47,881 |
| 2020 | $1,610 | $80,165 | $34,193 | $45,972 |
| 2019 | $1,524 | $78,161 | $34,193 | $43,968 |
| 2018 | $1,457 | $74,441 | $32,570 | $41,871 |
| 2017 | $1,421 | $70,984 | $30,157 | $40,827 |
| 2016 | $1,417 | $70,421 | $30,120 | $40,301 |
| 2015 | $1,333 | $70,421 | $30,120 | $40,301 |
| 2014 | $1,333 | $70,421 | $1,360 | $69,061 |
Map
- 300 Ellis Rd SE
- 189 Boyd Valley Rd SE
- 112 Boyd Valley Rd SE
- 1278 Chulio Rd SE
- 172 Sweet Water Ln SE
- 113 Miami Dr SE
- 122 Tugaloo Cir SE
- 119 Tugaloo Cir SE
- 121 Tugaloo Cir
- 5 Tugaloo Cir SE
- 36 Tugaloo Cir SE
- 30 Rushden Way SE
- 131 Hine Rd SE
- 28 Rushden Way SE
- 26 Rushden Way SE
- 7 Shirley Ln SE
- 530 Pleasant Valley Rd SE
- 14 Jewell Dr SE
- 15 Jewell Dr SE Unit 3
- 2 Rushden Way SE
- 1085 Mathis Rd SE
- 1085 Mathis Rd SE
- 1056 Mathis Rd SE
- 1056 Mathis Rd SE
- 1051 Mathis Rd SE
- 1051 Mathis Rd SE
- 1107 Mathis Rd SE
- 1019 Mathis Rd SE
- 1111 Mathis Rd SE
- 982 Mathis Rd SE
- 970 Mathis Rd SE
- 11 Powell Rd SE
- 4 Ellis Rd SE
- 0 Ellis Rd SE Unit 7 8223319
- 0 Ellis Rd SE Unit 5 8223292
- 0 Ellis Rd SE Unit 10084392
- 5 Ellis Rd SE
- 7 Ellis Rd SE
- 921 Mathis Rd SE
- 26 Ellis Rd SE
Ask me questions while you tour the home.