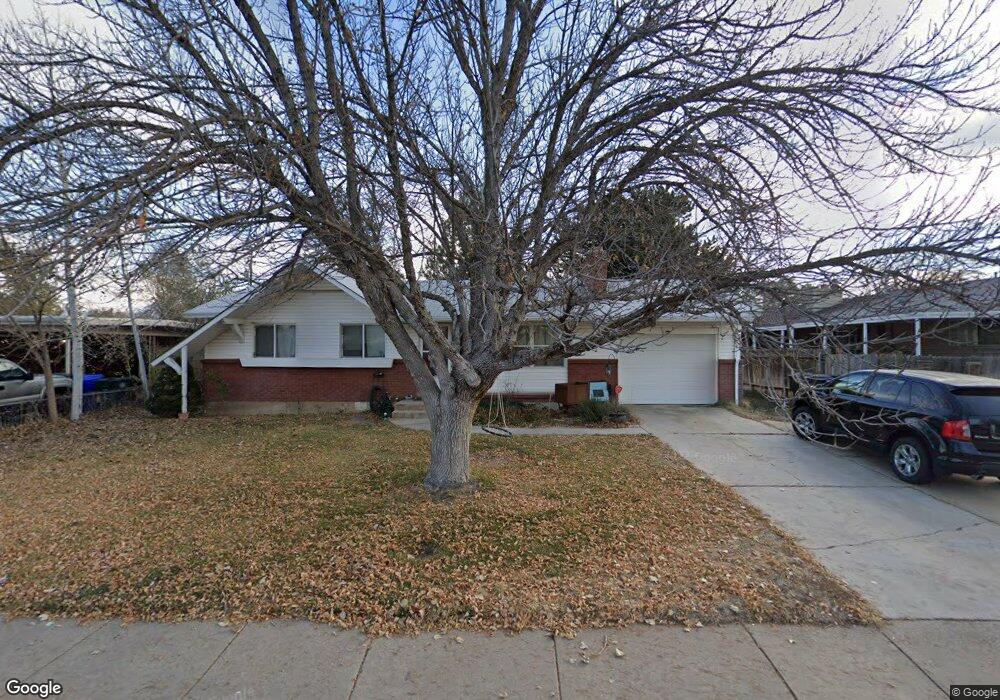
1084 N 390 W Clearfield, UT 84015
Estimated Value: $361,000 - $402,457
4
Beds
3
Baths
2,050
Sq Ft
$186/Sq Ft
Est. Value
About This Home
This home is located at 1084 N 390 W, Clearfield, UT 84015 and is currently estimated at $380,864, approximately $185 per square foot. 1084 N 390 W is a home located in Davis County with nearby schools including Doxey School, Sunset Junior High School, and Northridge High School.
Ownership History
Date
Name
Owned For
Owner Type
Purchase Details
Closed on
Nov 2, 2007
Sold by
Swenson Debra J and Stephens Debra
Bought by
Swenson Debra J and Swenson Dennis P
Current Estimated Value
Home Financials for this Owner
Home Financials are based on the most recent Mortgage that was taken out on this home.
Original Mortgage
$88,000
Outstanding Balance
$55,736
Interest Rate
6.4%
Mortgage Type
New Conventional
Estimated Equity
$325,128
Purchase Details
Closed on
Aug 22, 2003
Sold by
Hud
Bought by
Stephens Debra
Purchase Details
Closed on
May 20, 2003
Sold by
Mortgage Electronic Registration Service
Bought by
Hud
Purchase Details
Closed on
Apr 1, 2003
Sold by
Cornejo Francisco A and Membreno Elmer E
Bought by
Mers
Purchase Details
Closed on
Mar 7, 1997
Sold by
Ricks Clyde R
Bought by
Cornejo Francisco A and Membreno Elmer E
Home Financials for this Owner
Home Financials are based on the most recent Mortgage that was taken out on this home.
Original Mortgage
$105,777
Interest Rate
7.9%
Mortgage Type
FHA
Create a Home Valuation Report for This Property
The Home Valuation Report is an in-depth analysis detailing your home's value as well as a comparison with similar homes in the area
Home Values in the Area
Average Home Value in this Area
Purchase History
| Date | Buyer | Sale Price | Title Company |
|---|---|---|---|
| Swenson Debra J | -- | First American Title | |
| Stephens Debra | -- | Us Title Of Utah | |
| Hud | -- | -- | |
| Mers | $120,209 | -- | |
| Cornejo Francisco A | -- | Associated Title Company |
Source: Public Records
Mortgage History
| Date | Status | Borrower | Loan Amount |
|---|---|---|---|
| Open | Swenson Debra J | $88,000 | |
| Previous Owner | Cornejo Francisco A | $105,777 |
Source: Public Records
Tax History Compared to Growth
Tax History
| Year | Tax Paid | Tax Assessment Tax Assessment Total Assessment is a certain percentage of the fair market value that is determined by local assessors to be the total taxable value of land and additions on the property. | Land | Improvement |
|---|---|---|---|---|
| 2024 | $2,098 | $191,400 | $71,145 | $120,255 |
| 2023 | $1,972 | $328,000 | $113,639 | $214,361 |
| 2022 | $2,114 | $190,300 | $64,980 | $125,320 |
| 2021 | $1,802 | $255,000 | $70,041 | $184,959 |
| 2020 | $1,581 | $220,000 | $59,102 | $160,898 |
| 2019 | $1,507 | $215,000 | $75,027 | $139,973 |
| 2018 | $1,346 | $188,000 | $59,958 | $128,042 |
| 2016 | $1,179 | $84,645 | $28,351 | $56,294 |
| 2015 | $1,104 | $75,075 | $28,351 | $46,724 |
| 2014 | $1,132 | $78,667 | $28,539 | $50,128 |
| 2013 | -- | $68,720 | $23,265 | $45,455 |
Source: Public Records
Map
Nearby Homes