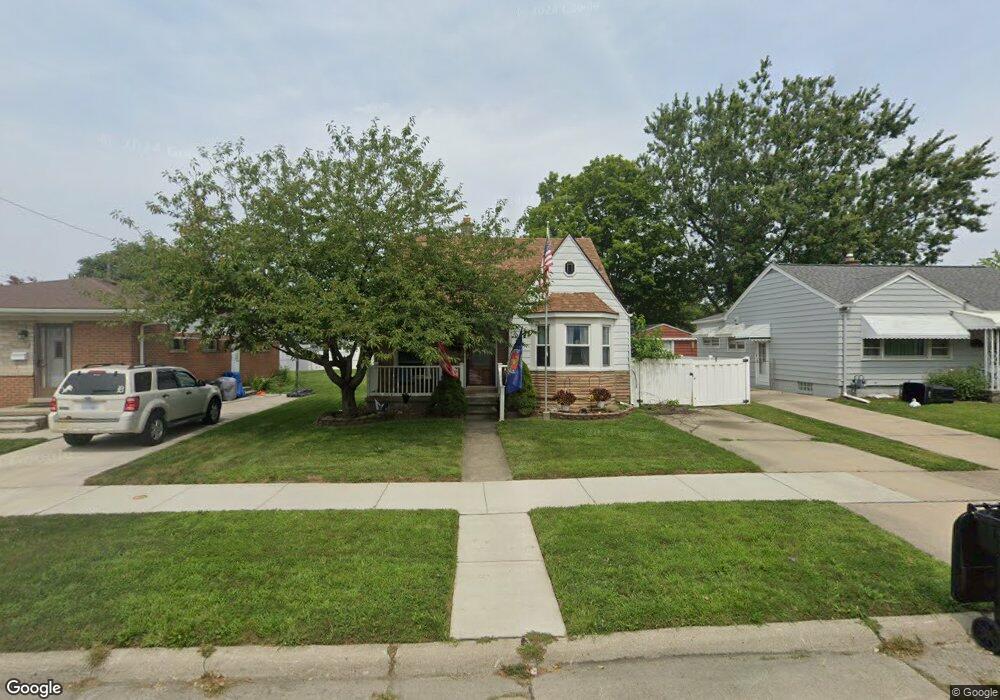
1084 Poplar Ct Wyandotte, MI 48192
Estimated Value: $160,000 - $204,000
3
Beds
1
Bath
1,021
Sq Ft
$182/Sq Ft
Est. Value
About This Home
This home is located at 1084 Poplar Ct, Wyandotte, MI 48192 and is currently estimated at $185,758, approximately $181 per square foot. 1084 Poplar Ct is a home located in Wayne County with nearby schools including Washington Elementary School, Woodrow Wilson School, and Roosevelt High School.
Ownership History
Date
Name
Owned For
Owner Type
Purchase Details
Closed on
Sep 7, 2010
Sold by
Mullins James L and Mullins Katie L
Bought by
Peterson Joseph R
Current Estimated Value
Purchase Details
Closed on
Mar 24, 2010
Sold by
Mullins James L and Kasprzyk Katie L
Bought by
Citibank Na
Purchase Details
Closed on
Dec 13, 2005
Sold by
Sharlow William J
Bought by
Mullins James L
Purchase Details
Closed on
Nov 2, 2004
Sold by
Sharlow William J and Sharlow Phyllis M
Bought by
Sharlow William J and William J Sharlow Living Trust
Create a Home Valuation Report for This Property
The Home Valuation Report is an in-depth analysis detailing your home's value as well as a comparison with similar homes in the area
Home Values in the Area
Average Home Value in this Area
Purchase History
| Date | Buyer | Sale Price | Title Company |
|---|---|---|---|
| Peterson Joseph R | $45,000 | Michigan Title Insurance Age | |
| Citibank Na | $57,900 | None Available | |
| Mullins James L | $136,000 | None Available | |
| Sharlow William J | -- | -- |
Source: Public Records
Tax History Compared to Growth
Tax History
| Year | Tax Paid | Tax Assessment Tax Assessment Total Assessment is a certain percentage of the fair market value that is determined by local assessors to be the total taxable value of land and additions on the property. | Land | Improvement |
|---|---|---|---|---|
| 2025 | $2,435 | $79,400 | $0 | $0 |
| 2024 | $2,435 | $76,900 | $0 | $0 |
| 2023 | $2,322 | $71,300 | $0 | $0 |
| 2022 | $2,984 | $64,600 | $0 | $0 |
| 2021 | $2,915 | $59,600 | $0 | $0 |
| 2020 | $2,875 | $53,600 | $0 | $0 |
| 2019 | $2,832 | $47,300 | $0 | $0 |
| 2018 | $2,042 | $45,100 | $0 | $0 |
| 2017 | $1,418 | $45,100 | $0 | $0 |
| 2016 | $2,722 | $41,800 | $0 | $0 |
| 2015 | $3,665 | $38,800 | $0 | $0 |
| 2013 | $3,550 | $35,500 | $0 | $0 |
| 2012 | $2,014 | $37,200 | $8,800 | $28,400 |
Source: Public Records
Map
Nearby Homes