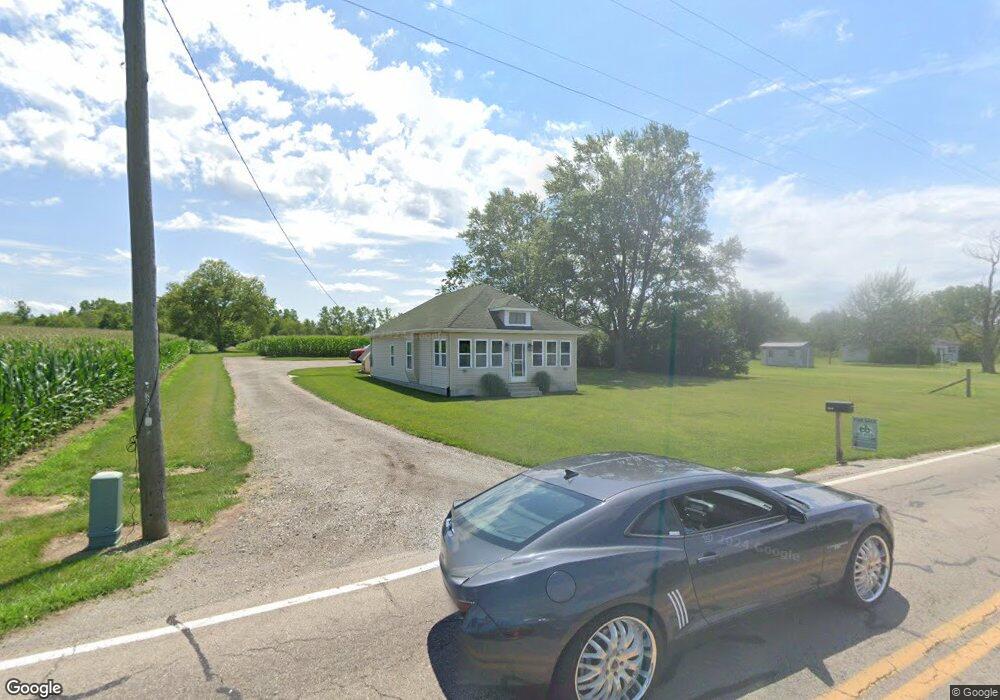
10840 Covington Bradford Rd Bradford, OH 45308
Estimated Value: $155,000 - $200,262
2
Beds
1
Bath
960
Sq Ft
$193/Sq Ft
Est. Value
About This Home
This home is located at 10840 Covington Bradford Rd, Bradford, OH 45308 and is currently estimated at $185,316, approximately $193 per square foot. 10840 Covington Bradford Rd is a home located in Miami County with nearby schools including Bradford Elementary School and Bradford High School.
Ownership History
Date
Name
Owned For
Owner Type
Purchase Details
Closed on
Jul 30, 2024
Sold by
Benedict James E
Bought by
Thomas Caleb A
Current Estimated Value
Home Financials for this Owner
Home Financials are based on the most recent Mortgage that was taken out on this home.
Original Mortgage
$155,000
Outstanding Balance
$153,246
Interest Rate
6.87%
Mortgage Type
New Conventional
Estimated Equity
$32,070
Purchase Details
Closed on
Apr 30, 2019
Sold by
Fike David K
Bought by
Benedict James E
Home Financials for this Owner
Home Financials are based on the most recent Mortgage that was taken out on this home.
Original Mortgage
$86,800
Interest Rate
4.2%
Mortgage Type
New Conventional
Purchase Details
Closed on
Oct 16, 2006
Sold by
Bollheimer Vilma
Bought by
Rank Benjamin P
Purchase Details
Closed on
Jun 1, 1983
Bought by
Bollheimer Vilma
Create a Home Valuation Report for This Property
The Home Valuation Report is an in-depth analysis detailing your home's value as well as a comparison with similar homes in the area
Home Values in the Area
Average Home Value in this Area
Purchase History
| Date | Buyer | Sale Price | Title Company |
|---|---|---|---|
| Thomas Caleb A | $195,000 | None Listed On Document | |
| Benedict James E | $108,500 | None Available | |
| Rank Benjamin P | $23,000 | -- | |
| Bollheimer Vilma | -- | -- |
Source: Public Records
Mortgage History
| Date | Status | Borrower | Loan Amount |
|---|---|---|---|
| Open | Thomas Caleb A | $155,000 | |
| Previous Owner | Benedict James E | $86,800 | |
| Closed | Rank Benjamin P | $0 |
Source: Public Records
Tax History Compared to Growth
Tax History
| Year | Tax Paid | Tax Assessment Tax Assessment Total Assessment is a certain percentage of the fair market value that is determined by local assessors to be the total taxable value of land and additions on the property. | Land | Improvement |
|---|---|---|---|---|
| 2024 | $1,315 | $40,010 | $8,650 | $31,360 |
| 2023 | $1,315 | $40,010 | $8,650 | $31,360 |
| 2022 | $1,332 | $40,010 | $8,650 | $31,360 |
| 2021 | $1,085 | $30,770 | $6,650 | $24,120 |
| 2020 | $1,078 | $30,770 | $6,650 | $24,120 |
| 2019 | $1,075 | $30,770 | $6,650 | $24,120 |
| 2018 | $797 | $22,930 | $5,950 | $16,980 |
| 2017 | $806 | $22,930 | $5,950 | $16,980 |
| 2016 | $770 | $22,930 | $5,950 | $16,980 |
| 2015 | $734 | $21,630 | $5,600 | $16,030 |
| 2014 | $734 | $21,630 | $5,600 | $16,030 |
| 2013 | $746 | $21,630 | $5,600 | $16,030 |
Source: Public Records
Map
Nearby Homes
- 10770 U S 36
- 320 E Church St
- 310 E Main St
- 324 E Elm St
- 235 E Church St
- 219 E Church St
- 231 E Vine St
- 124 E Keller St
- 427 S Miami Ave
- 142 W James St
- 9983 New Harrison Bradford Rd
- 9983 New Harrison-Bradford Rd
- 206 W Elm St
- 311 School St
- 211 W Elm St
- 9145 W US Route 36
- 6985 Smith Road 1
- 6791 Smith Rd
- 501 N Main St Unit C1
- 5225 N Front St
- 10840 W Cov Bradford Rd
- 10740 Covington Bradford Rd
- 10727 Covington Bradford Rd
- 10980 Covington Bradford Rd
- 6515 Bradford Bloomer Rd
- 6605 Bradford Bloomer Rd
- 11040 Covington Bradford Rd
- 6645 Bradford Bloomer Rd
- 11045 Covington Bradford Rd
- 11080 Covington Bradford Rd
- 11080 Covington-Bradford Rd
- 11100 Covington Bradford Rd
- 11101 Covington Bradford Rd
- 11130 Covington Bradford Rd
- 10525 Covington Bradford Rd
- 11160 Covington Bradford Rd
- 11160 Covington-Bradford Rd
- 11210 Covington Bradford Rd
- 11245 Covington Bradford Rd
- 11250 Covington Bradford Rd