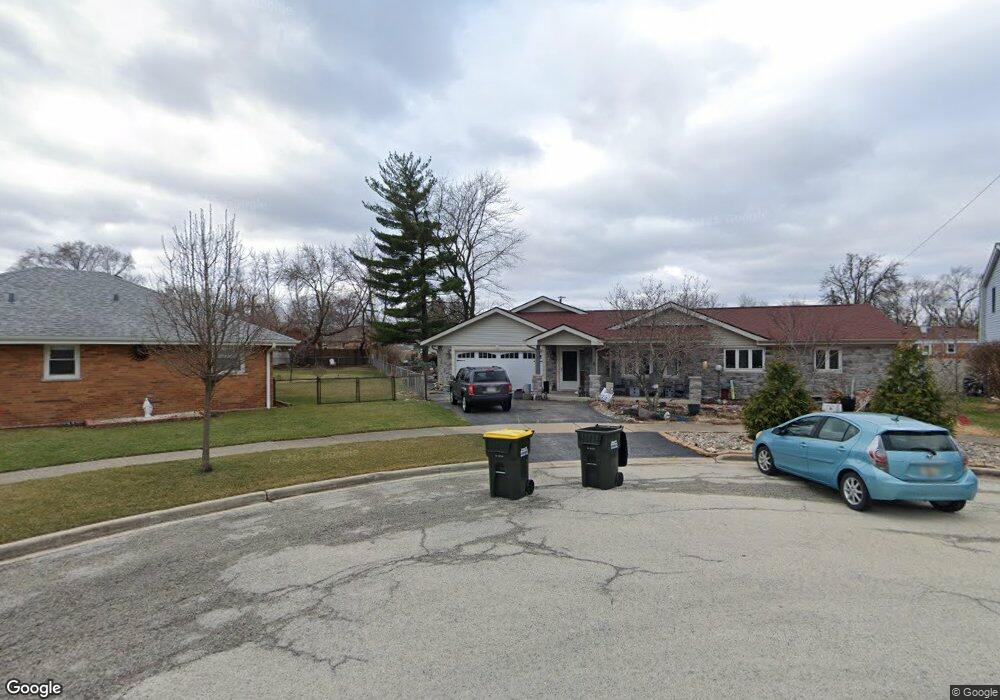
10840 Mason Ave Chicago Ridge, IL 60415
Estimated Value: $280,000 - $301,000
3
Beds
2
Baths
1,132
Sq Ft
$258/Sq Ft
Est. Value
About This Home
This home is located at 10840 Mason Ave, Chicago Ridge, IL 60415 and is currently estimated at $291,833, approximately $257 per square foot. 10840 Mason Ave is a home located in Cook County with nearby schools including Ridge Central Elementary School, Elden D Finley Jr High School, and Harold L. Richards High School.
Ownership History
Date
Name
Owned For
Owner Type
Purchase Details
Closed on
Jun 29, 2006
Sold by
Colburn James S and Colburn Diane M
Bought by
Joy Julianna M
Current Estimated Value
Home Financials for this Owner
Home Financials are based on the most recent Mortgage that was taken out on this home.
Original Mortgage
$215,000
Outstanding Balance
$128,133
Interest Rate
6.72%
Mortgage Type
Purchase Money Mortgage
Estimated Equity
$163,700
Purchase Details
Closed on
Sep 24, 1997
Sold by
Colburn James S and Mendes Diane M
Bought by
Colburn James S and Colburn Diane M
Home Financials for this Owner
Home Financials are based on the most recent Mortgage that was taken out on this home.
Original Mortgage
$119,000
Interest Rate
7.54%
Purchase Details
Closed on
Sep 14, 1994
Sold by
Marcione Robert J
Bought by
Colburn James S and Mendes Diane M
Home Financials for this Owner
Home Financials are based on the most recent Mortgage that was taken out on this home.
Original Mortgage
$122,400
Interest Rate
8.44%
Create a Home Valuation Report for This Property
The Home Valuation Report is an in-depth analysis detailing your home's value as well as a comparison with similar homes in the area
Home Values in the Area
Average Home Value in this Area
Purchase History
| Date | Buyer | Sale Price | Title Company |
|---|---|---|---|
| Joy Julianna M | $254,000 | Multiple | |
| Colburn James S | -- | -- | |
| Colburn James S | $136,000 | -- |
Source: Public Records
Mortgage History
| Date | Status | Borrower | Loan Amount |
|---|---|---|---|
| Open | Joy Julianna M | $215,000 | |
| Previous Owner | Colburn James S | $119,000 | |
| Previous Owner | Colburn James S | $122,400 |
Source: Public Records
Tax History Compared to Growth
Tax History
| Year | Tax Paid | Tax Assessment Tax Assessment Total Assessment is a certain percentage of the fair market value that is determined by local assessors to be the total taxable value of land and additions on the property. | Land | Improvement |
|---|---|---|---|---|
| 2024 | $6,060 | $22,000 | $6,285 | $15,715 |
| 2023 | $5,650 | $22,000 | $6,285 | $15,715 |
| 2022 | $5,650 | $17,841 | $5,499 | $12,342 |
| 2021 | $5,440 | $17,841 | $5,499 | $12,342 |
| 2020 | $5,458 | $17,841 | $5,499 | $12,342 |
| 2019 | $4,560 | $15,106 | $4,975 | $10,131 |
| 2018 | $4,333 | $15,106 | $4,975 | $10,131 |
| 2017 | $5,042 | $16,932 | $4,975 | $11,957 |
| 2016 | $4,162 | $12,929 | $4,190 | $8,739 |
| 2015 | $4,033 | $12,929 | $4,190 | $8,739 |
| 2014 | $3,970 | $12,929 | $4,190 | $8,739 |
| 2013 | $4,652 | $15,974 | $4,190 | $11,784 |
Source: Public Records
Map
Nearby Homes
- 5924 W 109th St
- 10755 Mason Ave
- 5825 109th St
- 10925 Mcvicker Ave
- 10925 Lyman Ave
- 10854 Lyman Ave
- 10832 Massasoit Ave
- 11024 Mason Ave
- 10937 Moody Ave
- 11013 Menard Ave
- 5810 107th Court Way
- 5730 110th St
- 6040 111th St
- 10807 Oak Ave
- 10529 Lyman Ave
- 10930 Central Ave Unit 1B
- 10821 Princess Ave
- 10706 Oak Ave
- 10710 Central Ave Unit 3D
- 11000 Central Ave Unit 2C
- 5933 108th Place
- 10832 Mason Ave
- 10841 Austin Ave
- 10849 Austin Ave
- 10833 Austin Ave
- 10824 Mason Ave
- 5940 109th St
- 5948 109th St
- 5925 108th Place
- 10825 Austin Ave
- 5924 108th Place
- 5924 109th St
- 10816 Mason Ave
- 5917 108th Place
- 10817 Austin Ave
- 5916 108th Place
- 5916 109th St
- 10817 Mason Ave
- 10836 Austin Ave