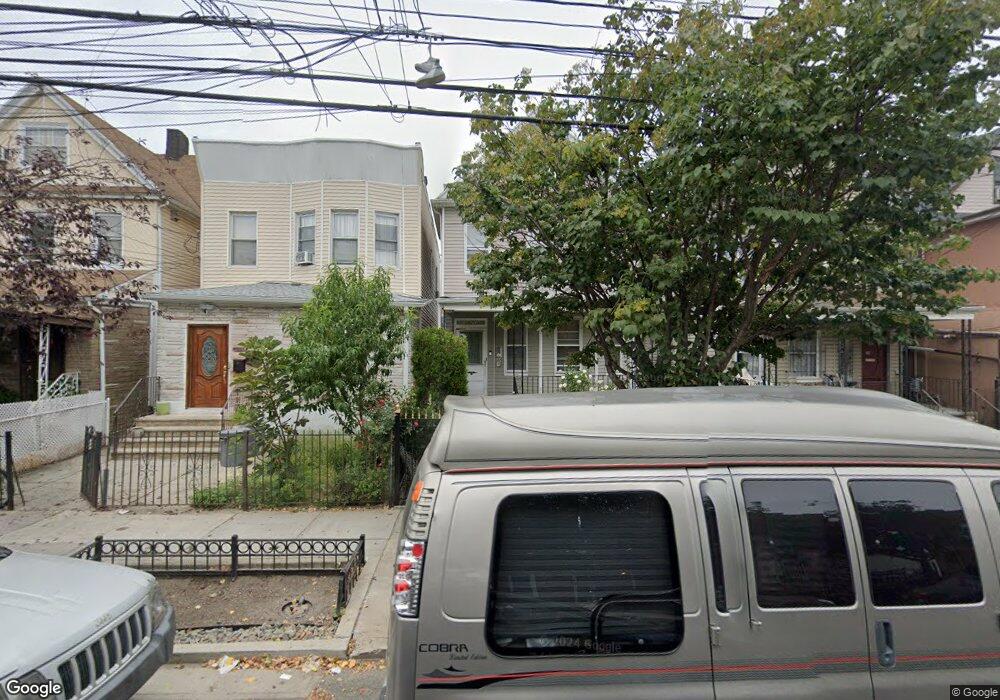
10845 38th Ave Corona, NY 11368
Corona NeighborhoodEstimated Value: $840,000 - $1,074,000
--
Bed
--
Bath
1,768
Sq Ft
$530/Sq Ft
Est. Value
About This Home
This home is located at 10845 38th Ave, Corona, NY 11368 and is currently estimated at $937,302, approximately $530 per square foot. 10845 38th Ave is a home located in Queens County with nearby schools including P.S. 143 Louis Armstrong, Is 61 Leonardo Da Vinci, and Flushing High School.
Ownership History
Date
Name
Owned For
Owner Type
Purchase Details
Closed on
May 6, 2009
Sold by
Quezada Christian E and Quezada Jose E
Bought by
Quezada Jose E and Quezada Maria T
Current Estimated Value
Purchase Details
Closed on
Oct 14, 2002
Sold by
Quezada Chritian E and Quezada Jose E
Bought by
Quezada Christian E and Quezada Jose E
Purchase Details
Closed on
May 27, 1999
Sold by
Pacheco Henry
Bought by
Quezada Jose E and Quezada Maria T
Home Financials for this Owner
Home Financials are based on the most recent Mortgage that was taken out on this home.
Original Mortgage
$218,500
Interest Rate
7.09%
Purchase Details
Closed on
May 9, 1996
Sold by
Pacheco Hipolito and Bustinza Luis
Bought by
Pacheco Henry
Home Financials for this Owner
Home Financials are based on the most recent Mortgage that was taken out on this home.
Original Mortgage
$150,000
Interest Rate
11.75%
Create a Home Valuation Report for This Property
The Home Valuation Report is an in-depth analysis detailing your home's value as well as a comparison with similar homes in the area
Home Values in the Area
Average Home Value in this Area
Purchase History
| Date | Buyer | Sale Price | Title Company |
|---|---|---|---|
| Quezada Jose E | $30,000 | -- | |
| Quezada Jose E | $30,000 | -- | |
| Quezada Christian E | -- | -- | |
| Quezada Christian E | -- | -- | |
| Quezada Jose E | $230,000 | First American Title Ins Co | |
| Quezada Jose E | $230,000 | First American Title Ins Co | |
| Pacheco Henry | -- | Ticor Title Guarantee Compan | |
| Pacheco Henry | -- | Ticor Title Guarantee Compan |
Source: Public Records
Mortgage History
| Date | Status | Borrower | Loan Amount |
|---|---|---|---|
| Previous Owner | Quezada Jose E | $218,500 | |
| Previous Owner | Pacheco Henry | $150,000 |
Source: Public Records
Tax History Compared to Growth
Tax History
| Year | Tax Paid | Tax Assessment Tax Assessment Total Assessment is a certain percentage of the fair market value that is determined by local assessors to be the total taxable value of land and additions on the property. | Land | Improvement |
|---|---|---|---|---|
| 2025 | $5,872 | $30,954 | $6,552 | $24,402 |
| 2024 | $5,872 | $29,237 | $5,815 | $23,422 |
| 2023 | $5,613 | $27,946 | $5,364 | $22,582 |
| 2022 | $5,321 | $60,360 | $12,840 | $47,520 |
| 2021 | $5,610 | $61,080 | $12,840 | $48,240 |
| 2020 | $5,460 | $57,660 | $12,840 | $44,820 |
| 2019 | $5,097 | $49,380 | $12,840 | $36,540 |
| 2018 | $4,747 | $23,288 | $5,423 | $17,865 |
| 2017 | $4,528 | $22,213 | $6,791 | $15,422 |
| 2016 | $4,441 | $22,213 | $6,791 | $15,422 |
| 2015 | $2,308 | $21,496 | $9,617 | $11,879 |
| 2014 | $2,308 | $20,304 | $8,883 | $11,421 |
Source: Public Records
Map
Nearby Homes
- 108-20 38th Ave
- 108-22 38th Ave
- 37-45 108th St
- 37-17 111th St Unit 2D
- 37-17 111th St Unit 5B
- 108-13 37th Ave
- 111-15 37th Ave
- 107-16 37th Ave Unit 4B
- 107-16 37th Ave Unit 3B
- 37-33 107th St Unit 2A
- 37-33 107th St Unit 4A
- 104-64 39th Ave Unit 3A
- 104-48 37th Dr Unit 3A
- 34-64 111th St
- 3517 109th St
- 34-49 110th St
- 35-14 109th St
- 112-01 38th Ave
- 104-61 Roosevelt Ave
- 34-36 110th St
- 10849 38th Ave
- 10843 38th Ave
- 108-51 38th Ave
- 108-55 38th Ave
- 10851 38th Ave
- 10841 38th Ave
- 10853 38th Ave
- 10839 38th Ave
- 108-53 38th Ave Unit 2Ndfl
- 108-53 38th Ave
- 10853 38th Ave
- 10855 38th Ave
- 10835 38th Ave
- 108-35 38th Ave
- 10859 38th Ave
- 10833 38th Ave
- 10850 37th Dr
- 10852 37th Dr
- 108-43 38th Ave
- 10842 37th Dr