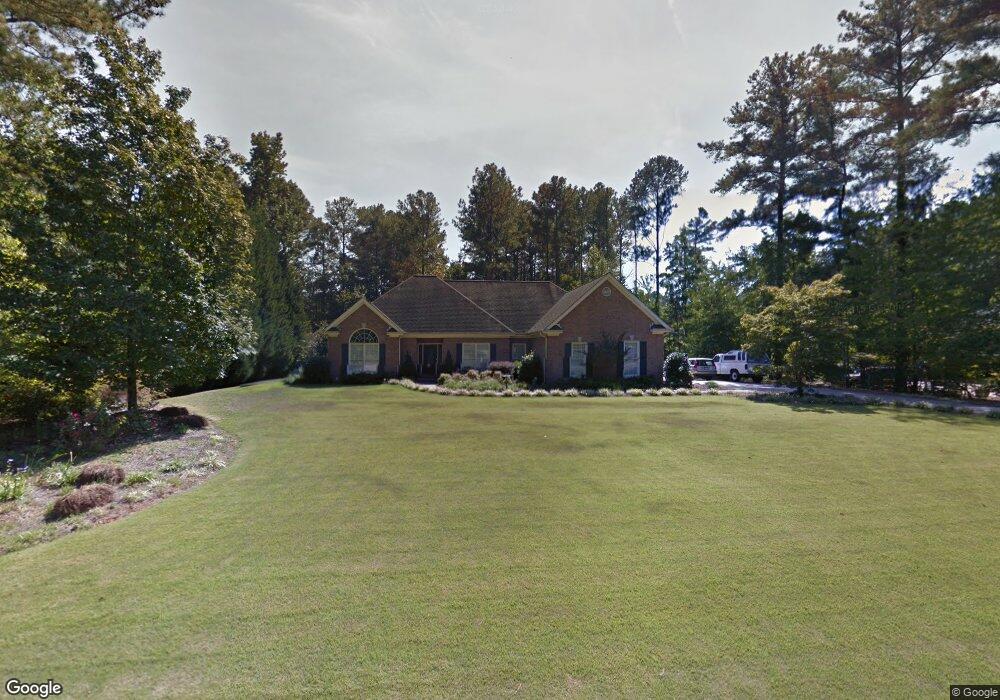
1085 Crabapple Trace Alpharetta, GA 30004
Estimated Value: $820,000 - $866,000
3
Beds
2
Baths
2,328
Sq Ft
$362/Sq Ft
Est. Value
About This Home
This home is located at 1085 Crabapple Trace, Alpharetta, GA 30004 and is currently estimated at $841,920, approximately $361 per square foot. 1085 Crabapple Trace is a home located in Fulton County with nearby schools including Crabapple Crossing Elementary School, Northwestern Middle School, and Milton High School.
Ownership History
Date
Name
Owned For
Owner Type
Purchase Details
Closed on
Feb 25, 2025
Sold by
Hill Carol
Bought by
Boston Richard Earl and Sheppard Jennifer Leigh
Current Estimated Value
Home Financials for this Owner
Home Financials are based on the most recent Mortgage that was taken out on this home.
Original Mortgage
$600,000
Outstanding Balance
$596,976
Interest Rate
6.95%
Mortgage Type
New Conventional
Estimated Equity
$244,944
Purchase Details
Closed on
Mar 2, 2011
Sold by
Hill Charles C
Bought by
Hill Charles C and Hill Carol N
Home Financials for this Owner
Home Financials are based on the most recent Mortgage that was taken out on this home.
Original Mortgage
$150,000
Interest Rate
4.71%
Mortgage Type
New Conventional
Purchase Details
Closed on
Jan 27, 2011
Sold by
Hill Charles F Trust
Bought by
Hill Charles C and Able Melanie
Home Financials for this Owner
Home Financials are based on the most recent Mortgage that was taken out on this home.
Original Mortgage
$150,000
Interest Rate
4.71%
Mortgage Type
New Conventional
Create a Home Valuation Report for This Property
The Home Valuation Report is an in-depth analysis detailing your home's value as well as a comparison with similar homes in the area
Home Values in the Area
Average Home Value in this Area
Purchase History
| Date | Buyer | Sale Price | Title Company |
|---|---|---|---|
| Boston Richard Earl | $800,000 | -- | |
| Hill Charles C | -- | -- | |
| Hill Charles C | -- | -- | |
| Hill Charles F Trust | -- | -- |
Source: Public Records
Mortgage History
| Date | Status | Borrower | Loan Amount |
|---|---|---|---|
| Open | Boston Richard Earl | $600,000 | |
| Previous Owner | Hill Charles C | $150,000 |
Source: Public Records
Tax History Compared to Growth
Tax History
| Year | Tax Paid | Tax Assessment Tax Assessment Total Assessment is a certain percentage of the fair market value that is determined by local assessors to be the total taxable value of land and additions on the property. | Land | Improvement |
|---|---|---|---|---|
| 2025 | $949 | $293,640 | $66,560 | $227,080 |
| 2023 | $949 | $275,600 | $52,960 | $222,640 |
| 2022 | $4,966 | $175,920 | $31,520 | $144,400 |
| 2021 | $5,616 | $170,800 | $30,600 | $140,200 |
| 2020 | $6,820 | $203,320 | $35,160 | $168,160 |
| 2019 | $1,046 | $181,960 | $82,840 | $99,120 |
| 2018 | $5,016 | $177,720 | $80,920 | $96,800 |
| 2017 | $3,873 | $132,760 | $27,800 | $104,960 |
| 2016 | $3,874 | $132,760 | $27,800 | $104,960 |
| 2015 | $4,654 | $132,760 | $27,800 | $104,960 |
| 2014 | $3,643 | $118,840 | $24,880 | $93,960 |
Source: Public Records
Map
Nearby Homes
- 1360 Bethany Ct
- 175 Heatherton Ln
- 245 Heatherton Way
- 1050 Little River Ln
- 275 Heatherton Way
- 1645 Mayfield Rd
- 1580 Mayfield Rd
- 785 Briars Bend
- 12455 Pindell Cir
- 13039 Freemanville Rd
- 1065 Mid Broadwell Rd
- 2200 Cortland Rd
- 7412 Mid Broadwell Trace
- 1500 Mid Broadwell Rd
- 1395 Mid Broadwell Rd
- 145 Pruitt Dr
- 7411 Mid Broadwell Trace
- 1835 Henley Way
- 1095 Chantilly Dr Unit 2
- 1075 Crabapple Trace Unit 2
- 1055 Chantilly Dr Unit 2
- 1065 Chantilly Dr
- 1090 Crabapple Trace Unit 2
- 1045 Chantilly Dr
- 1080 Crabapple Trace Unit 2
- 1065 Crabapple Trace
- 1070 Crabapple Trace
- 1035 Chantilly Dr
- Lot 9 Chantilly Dr
- 1090 Chantilly Dr
- 1375 Mayfield Rd
- 1285 Mayfield Rd Unit 1
- 1080 Chantilly Dr
- 1035 Crabapple Trace
- 1265 Mayfield Rd
- 1050 Chantilly Dr
- 1040 Chantilly Dr
- 1060 Crabapple Trace