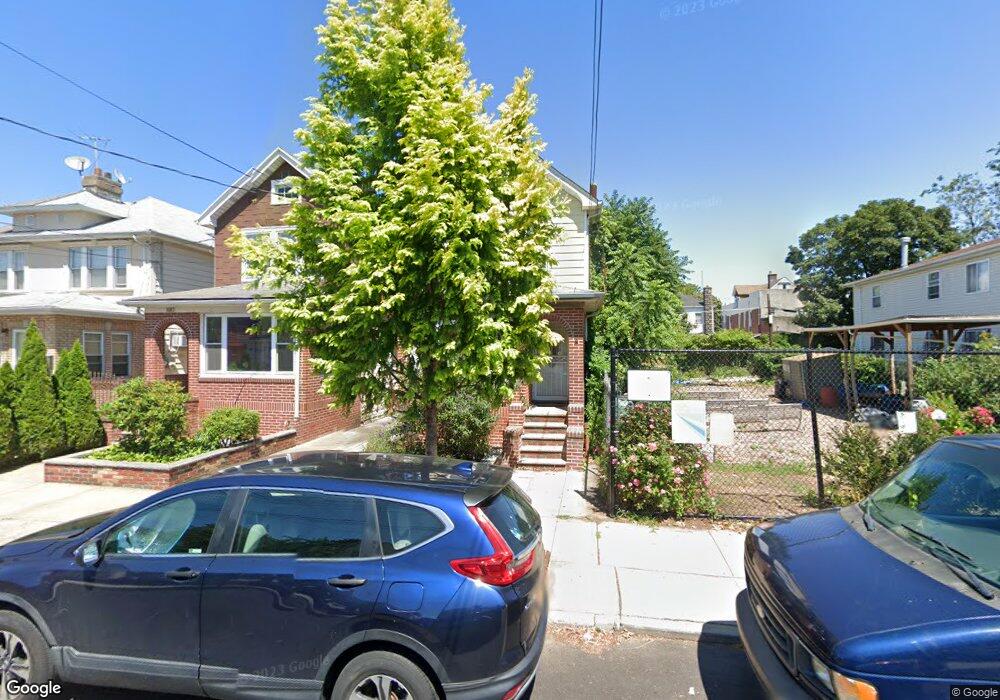
1085 E 43rd St Brooklyn, NY 11210
Flatlands NeighborhoodEstimated Value: $790,640 - $862,000
Studio
--
Bath
1,400
Sq Ft
$588/Sq Ft
Est. Value
About This Home
This home is located at 1085 E 43rd St, Brooklyn, NY 11210 and is currently estimated at $822,910, approximately $587 per square foot. 1085 E 43rd St is a home located in Kings County with nearby schools including P.S. 119 Amersfort, Andries Hudde School, and Christian Heritage Academy.
Ownership History
Date
Name
Owned For
Owner Type
Purchase Details
Closed on
Nov 8, 2006
Sold by
Brideson Dawn M
Bought by
Davis Lakecia and Flueck Christoph
Current Estimated Value
Home Financials for this Owner
Home Financials are based on the most recent Mortgage that was taken out on this home.
Original Mortgage
$394,320
Outstanding Balance
$235,596
Interest Rate
6.39%
Mortgage Type
Purchase Money Mortgage
Estimated Equity
$587,314
Purchase Details
Closed on
Apr 1, 2002
Sold by
Hud
Bought by
Facey Michael A and Brideson Dawn M
Home Financials for this Owner
Home Financials are based on the most recent Mortgage that was taken out on this home.
Original Mortgage
$191,450
Interest Rate
6.61%
Purchase Details
Closed on
Jul 5, 2000
Sold by
Firstar Bank Na
Bought by
Hud
Purchase Details
Closed on
Apr 11, 2000
Sold by
Hinds Ronald R
Bought by
Firstar Bank Na and Star Bank Na
Purchase Details
Closed on
Jan 28, 1998
Sold by
Joseph Tony
Bought by
Hinds Ronald K
Home Financials for this Owner
Home Financials are based on the most recent Mortgage that was taken out on this home.
Original Mortgage
$157,700
Interest Rate
7.03%
Mortgage Type
FHA
Create a Home Valuation Report for This Property
The Home Valuation Report is an in-depth analysis detailing your home's value as well as a comparison with similar homes in the area
Home Values in the Area
Average Home Value in this Area
Purchase History
| Date | Buyer | Sale Price | Title Company |
|---|---|---|---|
| Davis Lakecia | $492,900 | -- | |
| Facey Michael A | -- | -- | |
| Hud | -- | -- | |
| Firstar Bank Na | $171,654 | -- | |
| Hinds Ronald K | $160,000 | Chicago Title Insurance Co |
Source: Public Records
Mortgage History
| Date | Status | Borrower | Loan Amount |
|---|---|---|---|
| Open | Davis Lakecia | $394,320 | |
| Previous Owner | Facey Michael A | $191,450 | |
| Previous Owner | Hinds Ronald K | $157,700 |
Source: Public Records
Tax History
| Year | Tax Paid | Tax Assessment Tax Assessment Total Assessment is a certain percentage of the fair market value that is determined by local assessors to be the total taxable value of land and additions on the property. | Land | Improvement |
|---|---|---|---|---|
| 2025 | $5,723 | $53,520 | $7,620 | $45,900 |
| 2024 | $5,723 | $43,380 | $7,620 | $35,760 |
| 2023 | $5,579 | $40,320 | $7,620 | $32,700 |
| 2022 | $5,477 | $36,360 | $7,620 | $28,740 |
| 2021 | $5,595 | $28,080 | $7,620 | $20,460 |
| 2020 | $2,614 | $30,420 | $7,620 | $22,800 |
| 2019 | $4,918 | $30,420 | $7,620 | $22,800 |
| 2018 | $4,607 | $24,060 | $7,620 | $16,440 |
| 2017 | $4,661 | $24,336 | $6,372 | $17,964 |
| 2016 | $4,353 | $23,325 | $6,426 | $16,899 |
| 2015 | $2,615 | $22,005 | $7,935 | $14,070 |
| 2014 | $2,615 | $20,760 | $8,460 | $12,300 |
Source: Public Records
Map
Nearby Homes
- 1775 Troy Ave
- 4555 Kings Hwy
- 4204 Avenue I
- 1130 E 42nd St
- 4109 Avenue I
- 4589 Kings Hwy
- 1173 E 43rd St
- 987 E 42nd St
- 1353 E 46th St
- 1684 Troy Ave
- 1153 E 40th St
- 1676 Troy Ave
- 1389 E 46th St
- 4702 Avenue I
- 4019 Avenue K
- 4115 Hubbard Place
- 1240 E 48th St
- 1065 E 39th St
- 4042 Hubbard Place
- 4032 Hubbard Place
- 1083 E 43rd St
- 1087 E 43rd St
- 1081 E 43rd St
- 1081 E 43rd St Unit Building
- 1079 E 43rd St
- 1095 E 43rd St
- 1075 E 43rd St
- 1097 E 43rd St
- 1788 Troy Ave
- 1073 E 43rd St
- 1790 Troy Ave
- 1786 Troy Ave
- 1792 Troy Ave
- 1784 Troy Ave
- 1780 Troy Ave
- 1071 E 43rd St
- 1099 E 43rd St
- 1798 Troy Ave
- 1778 Troy Ave
- 1802 Troy Ave
Your Personal Tour Guide
Ask me questions while you tour the home.