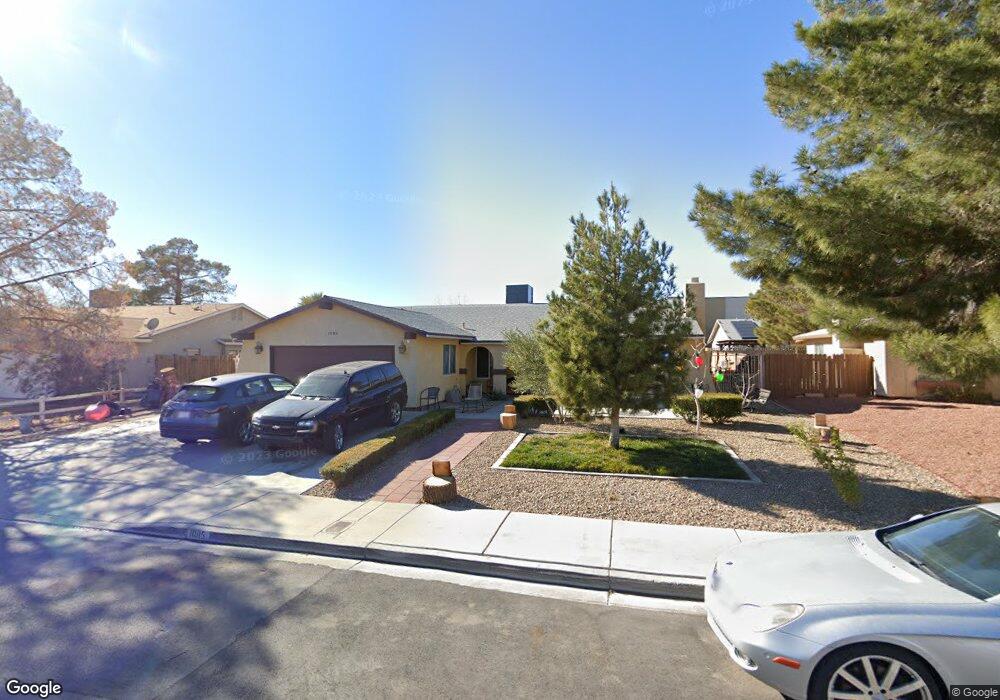
1085 Greymouth St Unit 3 Las Vegas, NV 89110
Estimated Value: $382,086 - $409,000
4
Beds
2
Baths
1,554
Sq Ft
$254/Sq Ft
Est. Value
About This Home
This home is located at 1085 Greymouth St Unit 3, Las Vegas, NV 89110 and is currently estimated at $394,272, approximately $253 per square foot. 1085 Greymouth St Unit 3 is a home located in Clark County with nearby schools including Stanford Elementary School, Duane D. Keller Middle School, and Eldorado High School.
Ownership History
Date
Name
Owned For
Owner Type
Purchase Details
Closed on
Dec 19, 2011
Sold by
Federal Home Loan Mortgage Corporation
Bought by
Escamilla Rodriguez J Jessus and Arreola Gonzalez Martha Patricia
Current Estimated Value
Home Financials for this Owner
Home Financials are based on the most recent Mortgage that was taken out on this home.
Original Mortgage
$90,455
Outstanding Balance
$61,639
Interest Rate
3.93%
Mortgage Type
New Conventional
Estimated Equity
$332,633
Purchase Details
Closed on
Jun 16, 2011
Sold by
Corral Jesus and Corral Ernestine
Bought by
Federal Home Loan Mortgage Corporation
Purchase Details
Closed on
May 20, 2005
Sold by
Valera Claro and Valera Lilia
Bought by
Corral Jesus and Corral Ernestine
Home Financials for this Owner
Home Financials are based on the most recent Mortgage that was taken out on this home.
Original Mortgage
$192,000
Interest Rate
5.74%
Mortgage Type
Fannie Mae Freddie Mac
Create a Home Valuation Report for This Property
The Home Valuation Report is an in-depth analysis detailing your home's value as well as a comparison with similar homes in the area
Home Values in the Area
Average Home Value in this Area
Purchase History
| Date | Buyer | Sale Price | Title Company |
|---|---|---|---|
| Escamilla Rodriguez J Jessus | $87,000 | Chicago Title Las Vegas | |
| Federal Home Loan Mortgage Corporation | $66,299 | Accommodation | |
| Corral Jesus | $240,000 | Ticor Title Of Nevada Inc |
Source: Public Records
Mortgage History
| Date | Status | Borrower | Loan Amount |
|---|---|---|---|
| Open | Escamilla Rodriguez J Jessus | $90,455 | |
| Previous Owner | Corral Jesus | $192,000 |
Source: Public Records
Tax History Compared to Growth
Tax History
| Year | Tax Paid | Tax Assessment Tax Assessment Total Assessment is a certain percentage of the fair market value that is determined by local assessors to be the total taxable value of land and additions on the property. | Land | Improvement |
|---|---|---|---|---|
| 2025 | $1,110 | $58,137 | $28,700 | $29,437 |
| 2024 | $1,084 | $58,137 | $28,700 | $29,437 |
| 2023 | $785 | $60,473 | $31,500 | $28,973 |
| 2022 | $1,097 | $52,427 | $25,550 | $26,877 |
| 2021 | $1,011 | $49,110 | $23,100 | $26,010 |
| 2020 | $936 | $48,252 | $22,050 | $26,202 |
| 2019 | $877 | $44,434 | $18,200 | $26,234 |
| 2018 | $837 | $41,927 | $16,450 | $25,477 |
| 2017 | $1,248 | $42,537 | $16,450 | $26,087 |
| 2016 | $785 | $37,730 | $10,850 | $26,880 |
| 2015 | $782 | $35,620 | $8,750 | $26,870 |
| 2014 | $758 | $25,057 | $7,000 | $18,057 |
Source: Public Records
Map
Nearby Homes
- 5717 Christchurch Ave
- 5855 Feather Falls Cir
- 1345 Stokes St
- 5923 Halehaven Dr
- 5754 Cinnabar Ave
- 5772 Cinnabar Ave
- 1286 N Sloan Ln
- 910 N Sloan Ln Unit 201
- 920 N Sloan Ln Unit 204
- 6030 Halehaven Dr
- 5383 E Washington Ave
- 741 Round Table Dr
- 0 Washington Unit 2360795
- 1491 Sunrise View Dr
- 5801 Sunny Orchard Ln
- 1325 Fairchild St
- 730 N Christy Ln
- 6165 Stanley Park Ave
- 740 Santree Cir
- 656 N Christy Ln
- 1095 Greymouth St
- 1084 Linn Ln
- 1094 Linn Ln
- 1074 Linn Ln
- 1115 Greymouth St
- 1065 Greymouth St
- 1086 Greymouth St
- 1076 Greymouth St
- 1114 Linn Ln
- 1064 Linn Ln
- 1096 Greymouth St
- 1066 Greymouth St
- 1125 Greymouth St
- 1055 Greymouth St
- 5753 Queenstown Way
- 1124 Linn Ln
- 1054 Linn Ln
- 1077 Singapore Ct
- 1087 Singapore Ct
- 1056 Greymouth St