1085 N 375 W Unit 20 Logan, UT 84341
Bridger NeighborhoodEstimated payment $1,481/month
Highlights
- Mature Trees
- Open Patio
- Partially Fenced Property
- Evaporated cooling system
- Sliding Doors
- Carpet
About This Home
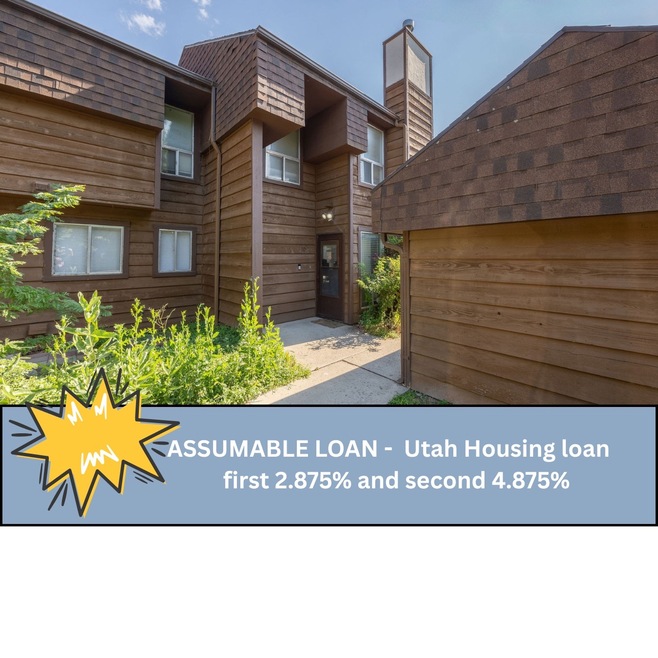
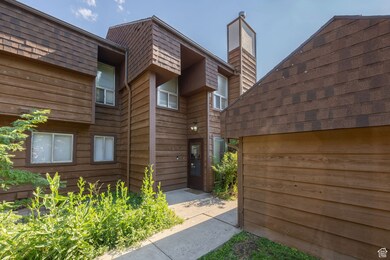
ASSUMABLE LOAN - You can assume this Utah Housing loan for as low as an interest rate at first 2.875% and second 4.875% call today for details. Why Rent When You Can Own? Perfect for Utah students or first-time buyers! This well-maintained end unit is clean, move-in ready, and priced to sell. It features two bedrooms and one bathroom. Enjoy your private patio and a fantastic location-just minutes from campus, shopping, dining, and more. Don't miss this opportunity for affordable, convenient living! Fiber was just installed in the home, and storage in the carport. GET IN BEFORE SCHOOL STARTS!!
Townhouse Details
Home Type
- Townhome
Est. Annual Taxes
- $1,050
Year Built
- Built in 1978
Lot Details
- 436 Sq Ft Lot
- Partially Fenced Property
- Mature Trees
HOA Fees
- $155 Monthly HOA Fees
Interior Spaces
- 904 Sq Ft Home
- 2-Story Property
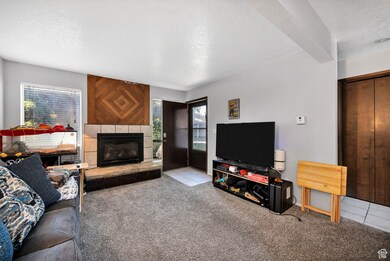
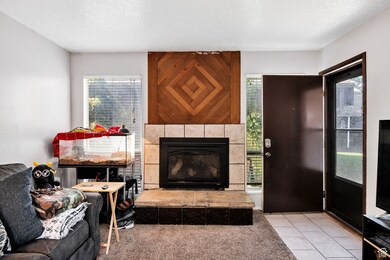
- Gas Log Fireplace
- Blinds
- Sliding Doors
- Carpet
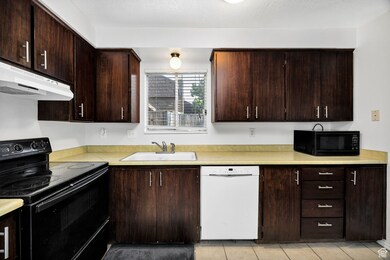
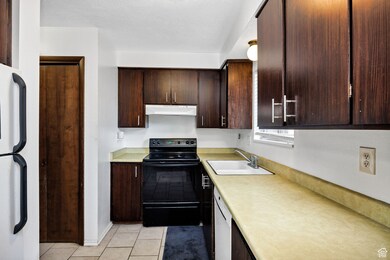
Kitchen
- Free-Standing Range
- Range Hood
- Disposal
Bedrooms and Bathrooms
- 2 Bedrooms
- 1 Full Bathroom
Laundry
- Dryer
- Washer
Parking
- 3 Parking Spaces
- 1 Carport Space
- 2 Open Parking Spaces
Outdoor Features
- Open Patio
Schools
- Bridger Elementary School
- Mt Logan Middle School
- Logan High School
Utilities
- Evaporated cooling system
- Heating Available
- Natural Gas Connected
Listing and Financial Details
- Assessor Parcel Number 07-125-0020
Community Details
Overview
- Cameron Forbis Association
- Ten O Two Townhouses Subdivision
Recreation
- Snow Removal
Map
Home Values in the Area
Average Home Value in this Area
Tax History
| Year | Tax Paid | Tax Assessment Tax Assessment Total Assessment is a certain percentage of the fair market value that is determined by local assessors to be the total taxable value of land and additions on the property. | Land | Improvement |
|---|---|---|---|---|
| 2025 | $997 | $128,975 | $0 | $0 |
| 2024 | $1,044 | $130,720 | $0 | $0 |
| 2023 | $1,012 | $120,815 | $0 | $0 |
| 2022 | $1,156 | $128,920 | $0 | $0 |
| 2021 | $946 | $163,000 | $25,000 | $138,000 |
| 2020 | $903 | $140,000 | $25,000 | $115,000 |
| 2019 | $743 | $110,243 | $25,000 | $85,243 |
| 2018 | $718 | $97,240 | $25,000 | $72,240 |
| 2017 | $634 | $45,375 | $0 | $0 |
| 2016 | $657 | $42,350 | $0 | $0 |
| 2015 | $614 | $42,350 | $0 | $0 |
| 2014 | $499 | $38,100 | $0 | $0 |
| 2013 | -- | $38,100 | $0 | $0 |
Property History
| Date | Event | Price | List to Sale | Price per Sq Ft |
|---|---|---|---|---|
| 10/06/2025 10/06/25 | Pending | -- | -- | -- |
| 08/06/2025 08/06/25 | Price Changed | $235,000 | -2.0% | $260 / Sq Ft |
| 07/17/2025 07/17/25 | For Sale | $239,900 | -- | $265 / Sq Ft |
Purchase History
| Date | Type | Sale Price | Title Company |
|---|---|---|---|
| Warranty Deed | -- | Cache Title Logan | |
| Warranty Deed | -- | Cache Title Logan |
Mortgage History
| Date | Status | Loan Amount | Loan Type |
|---|---|---|---|
| Open | $220,924 | FHA | |
| Previous Owner | $70,204 | FHA |
Source: UtahRealEstate.com
MLS Number: 2099432
APN: 07-125-0020
Disclaimer: Certain information contained herein is derived from information provided by parties other than Homes.com. All information provided is deemed reliable, but is not guaranteed to be accurate and should be independently verified.
![]() IDX information is provided exclusively for consumers’ personal, non-commercial use, that it may not be used for any purpose other than to identify prospective properties consumers may be interested in purchasing, and that the data is deemed reliable but is not guaranteed accurate by the MLS. Licensor is only providing the MLS Content and not other sources of data provided in the Product.
IDX information is provided exclusively for consumers’ personal, non-commercial use, that it may not be used for any purpose other than to identify prospective properties consumers may be interested in purchasing, and that the data is deemed reliable but is not guaranteed accurate by the MLS. Licensor is only providing the MLS Content and not other sources of data provided in the Product.
Based on information from the Wasatch Front Regional Multiple Listing Service, Inc.. All data, including all measurements and calculations of area, is obtained from various sources and has not been, and will not be, verified by broker or the MLS. All information should be independently reviewed and verified for accuracy. Properties may or may not be listed by the office/agent presenting the information.
