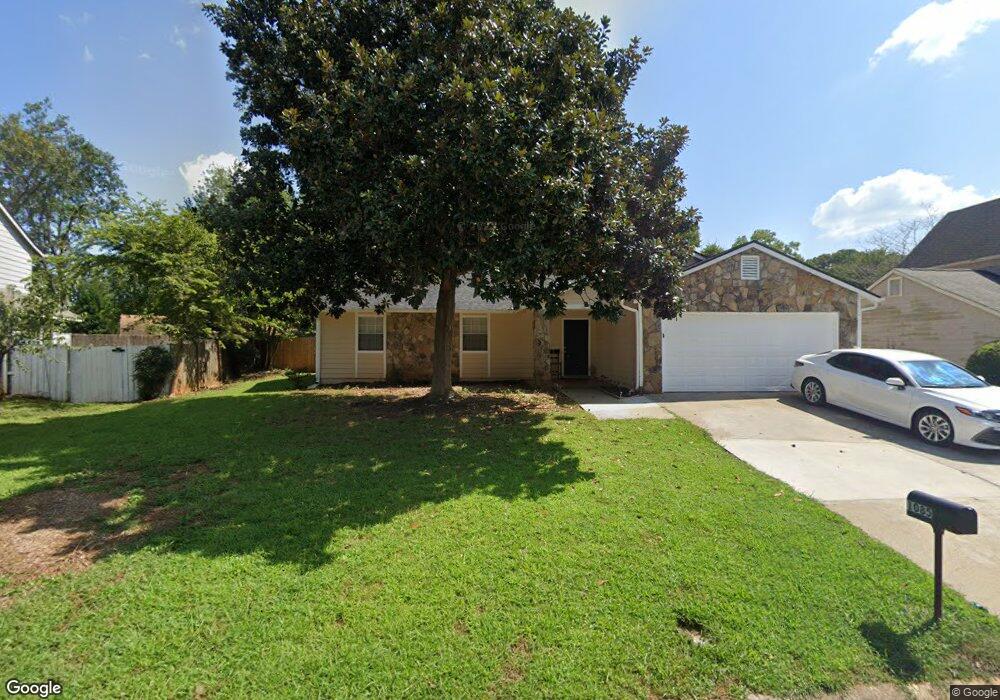
1085 Samuel Dr Norcross, GA 30093
Estimated Value: $267,000 - $342,000
3
Beds
2
Baths
1,376
Sq Ft
$228/Sq Ft
Est. Value
About This Home
This home is located at 1085 Samuel Dr, Norcross, GA 30093 and is currently estimated at $313,242, approximately $227 per square foot. 1085 Samuel Dr is a home located in Gwinnett County with nearby schools including Minor Elementary School, Berkmar Middle School, and Berkmar High School.
Ownership History
Date
Name
Owned For
Owner Type
Purchase Details
Closed on
Dec 1, 2011
Sold by
Fan Michael
Bought by
Atlanta Investment Holding Llc
Current Estimated Value
Purchase Details
Closed on
Aug 26, 2011
Sold by
Citibank Na
Bought by
Fan Michael and Huang Rani
Purchase Details
Closed on
Jan 4, 2011
Sold by
Hernandez Edilberto
Bought by
Citibank Na Series 2006-4
Purchase Details
Closed on
Jul 25, 2002
Sold by
Espinal Walter D
Bought by
Nava Fredi H
Home Financials for this Owner
Home Financials are based on the most recent Mortgage that was taken out on this home.
Original Mortgage
$119,605
Interest Rate
6.62%
Mortgage Type
New Conventional
Purchase Details
Closed on
Aug 26, 1999
Sold by
Tung Hawsen
Bought by
Espinal Walter D
Home Financials for this Owner
Home Financials are based on the most recent Mortgage that was taken out on this home.
Original Mortgage
$104,400
Interest Rate
7.5%
Mortgage Type
New Conventional
Create a Home Valuation Report for This Property
The Home Valuation Report is an in-depth analysis detailing your home's value as well as a comparison with similar homes in the area
Home Values in the Area
Average Home Value in this Area
Purchase History
| Date | Buyer | Sale Price | Title Company |
|---|---|---|---|
| Atlanta Investment Holding Llc | -- | -- | |
| Fan Michael | $40,100 | -- | |
| Citibank Na Series 2006-4 | $138,539 | -- | |
| Nava Fredi H | $125,900 | -- | |
| Espinal Walter D | $109,900 | -- |
Source: Public Records
Mortgage History
| Date | Status | Borrower | Loan Amount |
|---|---|---|---|
| Previous Owner | Nava Fredi H | $119,605 | |
| Previous Owner | Espinal Walter D | $104,400 |
Source: Public Records
Tax History Compared to Growth
Tax History
| Year | Tax Paid | Tax Assessment Tax Assessment Total Assessment is a certain percentage of the fair market value that is determined by local assessors to be the total taxable value of land and additions on the property. | Land | Improvement |
|---|---|---|---|---|
| 2024 | $3,347 | $85,040 | $19,200 | $65,840 |
| 2023 | $3,347 | $85,040 | $19,200 | $65,840 |
| 2022 | $3,397 | $87,680 | $19,200 | $68,480 |
| 2021 | $2,463 | $67,160 | $15,600 | $51,560 |
| 2020 | $2,463 | $62,640 | $13,200 | $49,440 |
| 2019 | $2,463 | $62,640 | $13,200 | $49,440 |
| 2018 | $2,176 | $54,520 | $10,880 | $43,640 |
| 2016 | $1,391 | $31,600 | $9,600 | $22,000 |
| 2015 | $1,407 | $31,600 | $6,800 | $24,800 |
| 2014 | $858 | $16,040 | $4,800 | $11,240 |
Source: Public Records
Map
Nearby Homes
- 1146 Samuel Dr
- 1151 Overland Hill Trace
- 4059 Heritage Valley Ct
- 4017 Heritage Valley Ct
- 1331 Sweet Pine Dr
- 918 Hampton Trail NW
- 881 Huntington Way NW
- 4092 Anvil Ct Unit 2
- 3826 Green Bay Dr Unit 2
- 4446 Arcadia Dr
- 4453 Freeman Ct Unit 1
- 3955 Peninsula Ct
- 4450 Bradstone Trace NW Unit 2
- 1432 Shenta Oak Dr
- 3951 Millwood Ln NW
- 3726 Green Bay Dr Unit 1
- 3975 Creek Water Ct Unit 1
- 3871 Pleasant Oaks Dr Unit 59
- 3836 Pleasant Oaks Dr
- 1075 Samuel Dr
- 1095 Samuel Dr Unit 1
- 4125 Phil Niekro Pkwy Unit 2
- 1098 Brittney Way
- 1118 Brittney Way
- 1065 Samuel Dr
- 1105 Samuel Dr Unit 1
- 1128 Brittney Way
- 1078 Brittney Way
- 1086 Samuel Dr
- 1086 Samuel Dr
- 1086 Samuel Dr Unit 176
- 1106 Samuel Dr Unit 1
- 1138 Brittney Way Unit 2
- 4143 Phil Niekro Pkwy
- 1068 Brittney Way
- 1115 Samuel Dr Unit 1
- 0 Brittney Way Unit 7294895
- 0 Brittney Way Unit 9062336
- 0 Brittney Way Unit 8796549