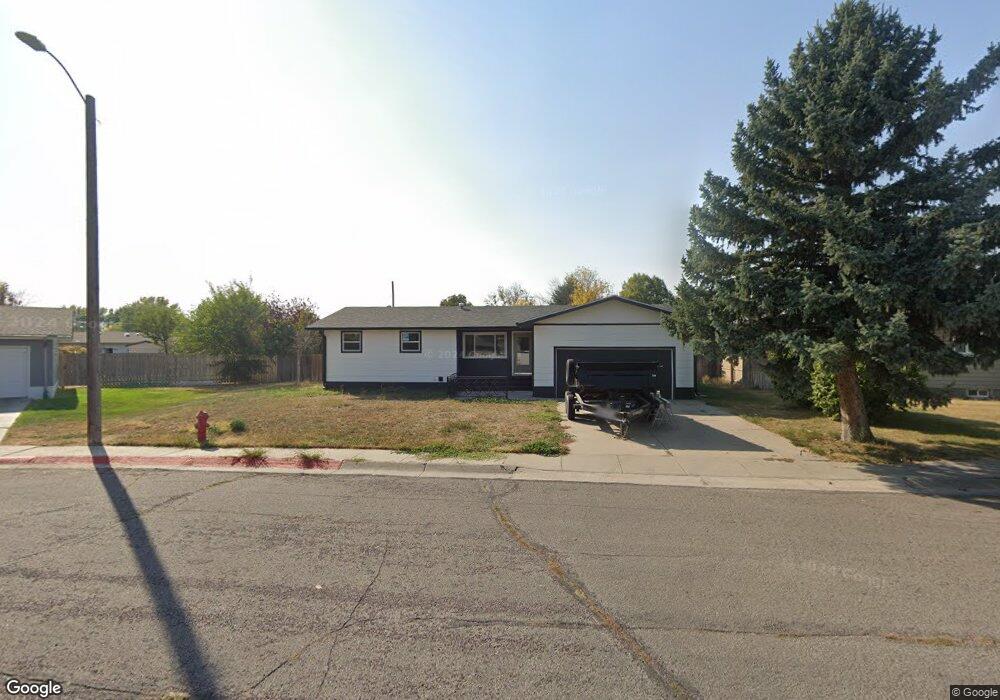
1085 Trail Ct Gering, NE 69341
Estimated Value: $294,169 - $330,000
3
Beds
2
Baths
1,432
Sq Ft
$219/Sq Ft
Est. Value
About This Home
This home is located at 1085 Trail Ct, Gering, NE 69341 and is currently estimated at $313,542, approximately $218 per square foot. 1085 Trail Ct is a home located in Scotts Bluff County with nearby schools including Gering High School and Community Christian Elementary/Middle School.
Ownership History
Date
Name
Owned For
Owner Type
Purchase Details
Closed on
Feb 21, 2025
Sold by
Bison Equity Llc
Bought by
Boyer Brian and Boyer Lorrie
Current Estimated Value
Purchase Details
Closed on
Sep 28, 2023
Sold by
Leach Michael L and Leach Nancy A
Bought by
Bison Equity Llc
Home Financials for this Owner
Home Financials are based on the most recent Mortgage that was taken out on this home.
Original Mortgage
$1,600
Interest Rate
7.09%
Mortgage Type
New Conventional
Purchase Details
Closed on
Aug 21, 2006
Sold by
Deines David L and Deines Loni M
Bought by
Leach Michael L and Leach Nancy A
Home Financials for this Owner
Home Financials are based on the most recent Mortgage that was taken out on this home.
Original Mortgage
$121,200
Interest Rate
6.77%
Mortgage Type
New Conventional
Create a Home Valuation Report for This Property
The Home Valuation Report is an in-depth analysis detailing your home's value as well as a comparison with similar homes in the area
Home Values in the Area
Average Home Value in this Area
Purchase History
| Date | Buyer | Sale Price | Title Company |
|---|---|---|---|
| Boyer Brian | $295,000 | None Listed On Document | |
| Bison Equity Llc | $160,000 | None Listed On Document | |
| Leach Michael L | $152,000 | -- |
Source: Public Records
Mortgage History
| Date | Status | Borrower | Loan Amount |
|---|---|---|---|
| Previous Owner | Bison Equity Llc | $1,600 | |
| Previous Owner | Leach Michael L | $121,200 |
Source: Public Records
Tax History Compared to Growth
Tax History
| Year | Tax Paid | Tax Assessment Tax Assessment Total Assessment is a certain percentage of the fair market value that is determined by local assessors to be the total taxable value of land and additions on the property. | Land | Improvement |
|---|---|---|---|---|
| 2024 | $3,863 | $223,650 | $33,135 | $190,515 |
| 2023 | $3,941 | $183,867 | $23,027 | $160,840 |
| 2022 | $3,941 | $183,867 | $23,027 | $160,840 |
| 2021 | $3,756 | $173,345 | $23,027 | $150,318 |
| 2020 | $3,622 | $166,187 | $23,027 | $143,160 |
| 2019 | $3,539 | $166,424 | $23,264 | $143,160 |
| 2018 | $3,560 | $166,424 | $23,264 | $143,160 |
| 2017 | $3,565 | $166,424 | $23,264 | $143,160 |
| 2016 | $3,310 | $166,424 | $23,264 | $143,160 |
| 2015 | $3,216 | $162,254 | $23,264 | $138,990 |
| 2014 | $3,262 | $162,254 | $23,264 | $138,990 |
| 2012 | -- | $159,529 | $23,264 | $136,265 |
Source: Public Records
Map
Nearby Homes