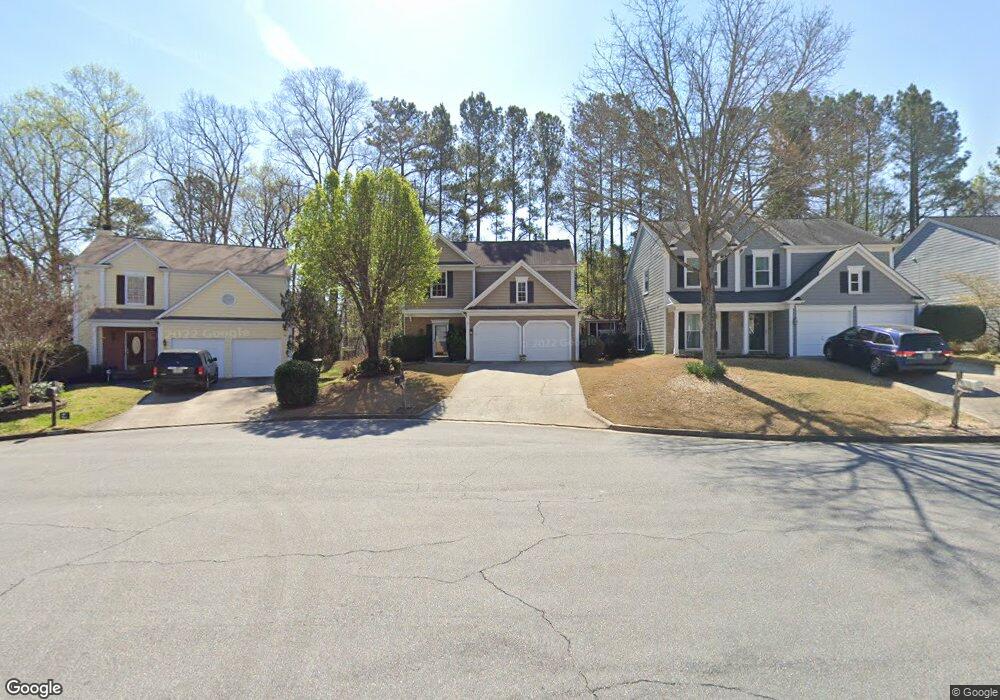
1085 Westwell Run Alpharetta, GA 30022
Newtown NeighborhoodEstimated Value: $557,552 - $597,000
4
Beds
3
Baths
2,132
Sq Ft
$269/Sq Ft
Est. Value
About This Home
This home is located at 1085 Westwell Run, Alpharetta, GA 30022 and is currently estimated at $574,138, approximately $269 per square foot. 1085 Westwell Run is a home located in Fulton County with nearby schools including Barnwell Elementary School, Autrey Mill Middle School, and Johns Creek High School.
Ownership History
Date
Name
Owned For
Owner Type
Purchase Details
Closed on
Jul 28, 2004
Sold by
Goodman Charles D and Goodman Misty
Bought by
Mcewen Tony L
Current Estimated Value
Home Financials for this Owner
Home Financials are based on the most recent Mortgage that was taken out on this home.
Original Mortgage
$170,800
Outstanding Balance
$37,376
Interest Rate
3.88%
Mortgage Type
New Conventional
Estimated Equity
$536,762
Purchase Details
Closed on
Mar 30, 2001
Sold by
Smith Shelly A
Bought by
Goodman Charles D and Goodman Misty B
Home Financials for this Owner
Home Financials are based on the most recent Mortgage that was taken out on this home.
Original Mortgage
$176,900
Interest Rate
6.9%
Mortgage Type
New Conventional
Purchase Details
Closed on
Nov 22, 1996
Sold by
Slovin David I
Bought by
Smith Shelly A
Purchase Details
Closed on
Feb 19, 1993
Sold by
Pulte Home Corp
Bought by
Slovin David I
Home Financials for this Owner
Home Financials are based on the most recent Mortgage that was taken out on this home.
Original Mortgage
$92,500
Interest Rate
8.06%
Create a Home Valuation Report for This Property
The Home Valuation Report is an in-depth analysis detailing your home's value as well as a comparison with similar homes in the area
Home Values in the Area
Average Home Value in this Area
Purchase History
| Date | Buyer | Sale Price | Title Company |
|---|---|---|---|
| Mcewen Tony L | $213,500 | -- | |
| Goodman Charles D | $189,600 | -- | |
| Smith Shelly A | $135,500 | -- | |
| Slovin David I | $116,700 | -- |
Source: Public Records
Mortgage History
| Date | Status | Borrower | Loan Amount |
|---|---|---|---|
| Open | Mcewen Tony L | $170,800 | |
| Previous Owner | Goodman Charles D | $176,900 | |
| Previous Owner | Slovin David I | $92,500 | |
| Closed | Smith Shelly A | $0 |
Source: Public Records
Tax History Compared to Growth
Tax History
| Year | Tax Paid | Tax Assessment Tax Assessment Total Assessment is a certain percentage of the fair market value that is determined by local assessors to be the total taxable value of land and additions on the property. | Land | Improvement |
|---|---|---|---|---|
| 2025 | $2,811 | $200,840 | $45,840 | $155,000 |
| 2023 | $5,195 | $184,040 | $42,680 | $141,360 |
| 2022 | $2,685 | $144,880 | $31,760 | $113,120 |
| 2021 | $2,649 | $121,760 | $26,120 | $95,640 |
| 2020 | $2,664 | $120,320 | $25,800 | $94,520 |
| 2019 | $325 | $121,520 | $24,880 | $96,640 |
| 2018 | $2,924 | $107,880 | $24,360 | $83,520 |
| 2017 | $2,610 | $89,480 | $20,040 | $69,440 |
| 2016 | $2,514 | $88,360 | $20,040 | $68,320 |
| 2015 | $2,541 | $88,360 | $20,040 | $68,320 |
| 2014 | $2,243 | $76,640 | $12,880 | $63,760 |
Source: Public Records
Map
Nearby Homes
- 10000 Barston Ct
- 320 Outwood Mill Ct
- 10090 Jones Bridge Rd Unit 8
- 10050 Lauren Hall Ct
- 300 Olmstead Way
- 201 Downing Dr Unit 76
- 10255 Old Woodland Entry
- 615 S Preston Ct
- 415 Wood Trace Ct
- 235 Wood Shoals Ct
- 130 Forrest View Terrace
- 595 Oak Alley Way
- 120 Thome Dr
- 10085 Old Woodland Entry
- 115 Thome Dr
- 305 Birch Rill Dr
- 125 Oak Bridge Ct Unit 2
- 3273 Long Indian Creek Ct
- 9715 Almaviva Dr
- 3815 Falls Landing Dr
- 1075 Westwell Run
- 1095 Westwell Run
- 640 Rosedown Way
- 1065 Westwell Run
- 2005 Westwell Run
- 630 Rosedown Way Unit 630
- 630 Rosedown Way
- 630 Rosedown Way
- 1055 Westwell Run
- 650 Rosedown Way
- 620 Rosedown Way
- 2090 Westwell Run
- 10010 Barston Ct
- 2050 Westwell Run
- 2060 Westwell Run
- 9990 Barston Ct
- 1045 Westwell Run Unit 1045
- 1045 Westwell Run
- 10020 Barston Ct
- 9980 Barston Ct