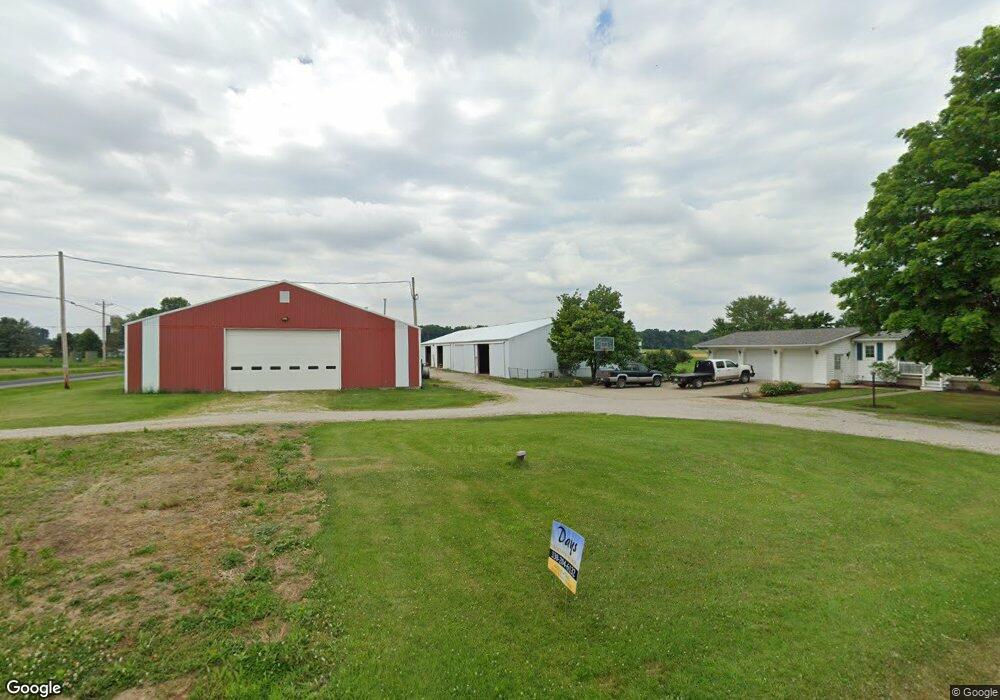
10850 Canaan Center Rd Creston, OH 44217
Estimated Value: $277,000 - $1,312,459
3
Beds
1
Bath
1,524
Sq Ft
$521/Sq Ft
Est. Value
About This Home
This home is located at 10850 Canaan Center Rd, Creston, OH 44217 and is currently estimated at $794,730, approximately $521 per square foot. 10850 Canaan Center Rd is a home located in Wayne County with nearby schools including Norwayne Elementary School, Norwayne Middle School, and Norwayne High School.
Ownership History
Date
Name
Owned For
Owner Type
Purchase Details
Closed on
Nov 8, 2003
Sold by
S & C Real Estate Llc
Bought by
Holsington Steven S and Holsington Dawn L
Current Estimated Value
Home Financials for this Owner
Home Financials are based on the most recent Mortgage that was taken out on this home.
Original Mortgage
$125,000
Interest Rate
5.5%
Mortgage Type
Balloon
Purchase Details
Closed on
Aug 22, 1997
Sold by
Hoisington Harley F
Bought by
Hoisington Steven S and Hoisington Dawn L
Home Financials for this Owner
Home Financials are based on the most recent Mortgage that was taken out on this home.
Original Mortgage
$45,500
Interest Rate
7.25%
Mortgage Type
New Conventional
Purchase Details
Closed on
May 16, 1988
Sold by
Hoisington Harley F and Hoisington Shi
Bought by
Hoisington Harley F and Hoisington Shi
Purchase Details
Closed on
Feb 10, 1987
Bought by
Hoisington Harley F and Hoisington Shi
Create a Home Valuation Report for This Property
The Home Valuation Report is an in-depth analysis detailing your home's value as well as a comparison with similar homes in the area
Home Values in the Area
Average Home Value in this Area
Purchase History
| Date | Buyer | Sale Price | Title Company |
|---|---|---|---|
| Holsington Steven S | $125,000 | -- | |
| Hoisington Steven S | $45,500 | -- | |
| Hoisington Harley F | -- | -- | |
| Hoisington Harley F | -- | -- |
Source: Public Records
Mortgage History
| Date | Status | Borrower | Loan Amount |
|---|---|---|---|
| Closed | Holsington Steven S | $125,000 | |
| Previous Owner | Hoisington Steven S | $45,500 |
Source: Public Records
Tax History Compared to Growth
Tax History
| Year | Tax Paid | Tax Assessment Tax Assessment Total Assessment is a certain percentage of the fair market value that is determined by local assessors to be the total taxable value of land and additions on the property. | Land | Improvement |
|---|---|---|---|---|
| 2024 | $3,829 | $277,150 | $215,080 | $62,070 |
| 2023 | $3,829 | $277,150 | $215,080 | $62,070 |
| 2022 | $3,403 | $277,150 | $215,080 | $62,070 |
| 2021 | $3,433 | $277,150 | $215,080 | $62,070 |
| 2020 | $3,451 | $277,150 | $215,080 | $62,070 |
| 2019 | $3,311 | $237,230 | $185,040 | $52,190 |
| 2018 | $3,328 | $237,230 | $185,040 | $52,190 |
| 2017 | $3,565 | $237,230 | $185,040 | $52,190 |
| 2016 | $3,876 | $173,810 | $121,620 | $52,190 |
| 2015 | $3,827 | $173,810 | $121,620 | $52,190 |
| 2014 | $4,105 | $179,670 | $121,620 | $58,050 |
| 2013 | $3,342 | $150,060 | $90,970 | $59,090 |
Source: Public Records
Map
Nearby Homes
- 11387 Canaan Center Rd
- 11835 Canaan Center Rd
- 2588 Fulton Rd
- 1457 Fox Lake Rd
- 10575 Burbank Rd
- 4156 Fieldridge Ct
- 7210 Cleveland Rd
- 3351 W Easton Rd
- 2710 E Hutton Rd
- 15292 Friendsville Rd
- 124 Garden St
- 888 Flag Stone Ave
- 154 Garden St
- 7190 N Geyers Chapel Rd
- 6294 Hoffman Rd
- 5974 Cleveland Rd Unit 23
- 153 S Main St
- 0 Burbank St
- 147 N Main St
- 6471 Easton Rd
- 10675 Canaan Center Rd
- 10650 Canaan Center Rd
- 11011 Canaan Center Rd
- 949 Steiner Rd
- 10634 Canaan Center Rd
- 11047 Canaan Center Rd
- 909 Steiner Rd
- 11089 Canaan Center Rd
- 11136 Canaan Center Rd
- 1417 Steiner Rd
- 823 Steiner Rd
- 11165 Canaan Center Rd
- 1520 Steiner Rd
- 1564 Steiner Rd
- 1600 Steiner Rd
- 11302 Canaan Center Rd
- 11299 Canaan Center Rd
- 1601 Steiner Rd
- 11301 Canaan Center Rd
- 1622 Steiner Rd