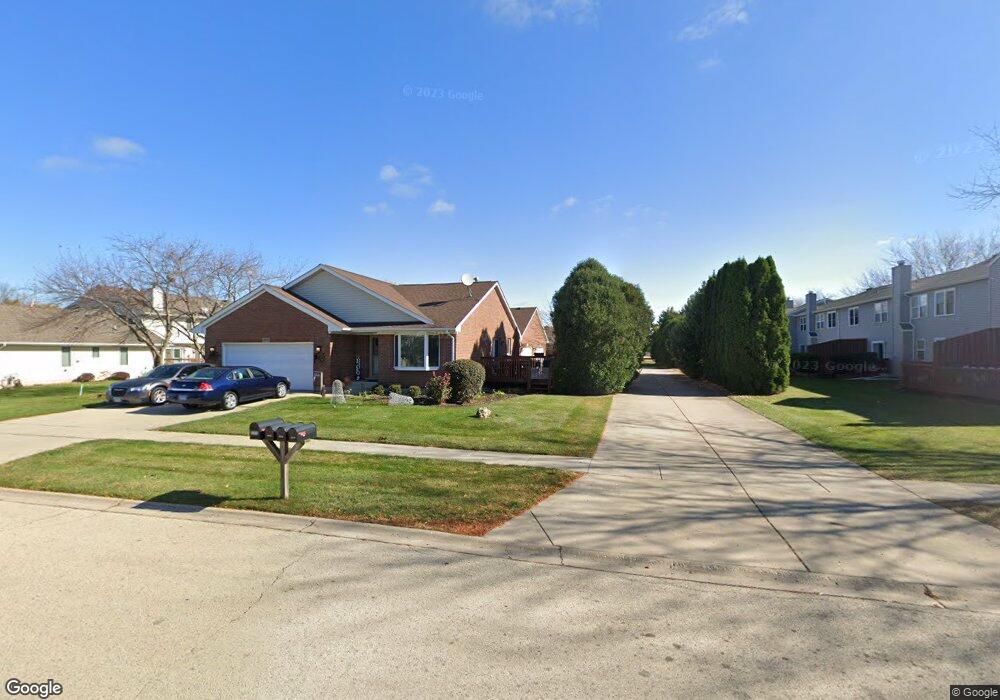
10850 Timer Dr W Unit 1 Huntley, IL 60142
Estimated Value: $237,715 - $336,000
2
Beds
--
Bath
1,214
Sq Ft
$249/Sq Ft
Est. Value
About This Home
This home is located at 10850 Timer Dr W Unit 1, Huntley, IL 60142 and is currently estimated at $302,679, approximately $249 per square foot. 10850 Timer Dr W Unit 1 is a home located in McHenry County with nearby schools including Martin Elementary School, Chesak Elementary School, and Marlowe Middle School.
Ownership History
Date
Name
Owned For
Owner Type
Purchase Details
Closed on
Jan 19, 2004
Sold by
Blocksom Darrel J and Blocksom Elizabeth J
Bought by
Sac Kevin
Current Estimated Value
Home Financials for this Owner
Home Financials are based on the most recent Mortgage that was taken out on this home.
Original Mortgage
$152,000
Outstanding Balance
$70,986
Interest Rate
5.88%
Mortgage Type
Unknown
Estimated Equity
$231,693
Purchase Details
Closed on
Jun 25, 1999
Sold by
Tock Heath R and Tock Jeanette L
Bought by
Blocksom Darrel J and Blocksom Elizabeth J
Home Financials for this Owner
Home Financials are based on the most recent Mortgage that was taken out on this home.
Original Mortgage
$117,000
Interest Rate
7.15%
Purchase Details
Closed on
Oct 20, 1995
Sold by
Harris Bank Marengo
Bought by
Tock Heath R and Hauser Jeanette L
Home Financials for this Owner
Home Financials are based on the most recent Mortgage that was taken out on this home.
Original Mortgage
$119,700
Interest Rate
7.65%
Create a Home Valuation Report for This Property
The Home Valuation Report is an in-depth analysis detailing your home's value as well as a comparison with similar homes in the area
Home Values in the Area
Average Home Value in this Area
Purchase History
| Date | Buyer | Sale Price | Title Company |
|---|---|---|---|
| Sac Kevin | $190,000 | Pntn | |
| Blocksom Darrel J | $157,000 | Fox Title Company | |
| Tock Heath R | $126,000 | Fox Title Company |
Source: Public Records
Mortgage History
| Date | Status | Borrower | Loan Amount |
|---|---|---|---|
| Open | Sac Kevin | $152,000 | |
| Previous Owner | Blocksom Darrel J | $117,000 | |
| Previous Owner | Tock Heath R | $119,700 | |
| Closed | Sac Kevin | $38,000 |
Source: Public Records
Tax History
| Year | Tax Paid | Tax Assessment Tax Assessment Total Assessment is a certain percentage of the fair market value that is determined by local assessors to be the total taxable value of land and additions on the property. | Land | Improvement |
|---|---|---|---|---|
| 2024 | $5,118 | $80,070 | $5,589 | $74,481 |
| 2023 | $4,949 | $71,928 | $5,021 | $66,907 |
| 2022 | $4,761 | $65,496 | $4,572 | $60,924 |
| 2021 | $4,605 | $61,684 | $4,306 | $57,378 |
| 2020 | $4,523 | $60,039 | $4,191 | $55,848 |
| 2019 | $4,411 | $58,506 | $4,084 | $54,422 |
| 2018 | $4,396 | $57,651 | $4,596 | $53,055 |
| 2017 | $4,295 | $54,331 | $4,331 | $50,000 |
| 2016 | $4,323 | $51,656 | $4,118 | $47,538 |
| 2013 | -- | $47,510 | $2,888 | $44,622 |
Source: Public Records
Map
Nearby Homes
- 10826 Timer Dr W Unit 2
- 0 Ruth Rd Unit MRD12258953
- 2.54 Ruth Rd
- 60.8 Main St
- Lot 2 Ryann Rd
- 11618 Douglas Ave
- 11611 Main St
- Lot 3 Ryann Rd
- Lot 1 Ryann Rd
- 10716 N Il Route 47
- 0000 Route 47
- 11008 L J Marak Dr
- 10978 L J Marak Dr
- 10864 Saxony St
- 10813 Chadsey Rd
- 10824 Saxony St
- 10855 Saxony St
- 10782 Chadsey Rd
- 10814 Saxony St
- 10793 Chadsey Rd
- 10852 Timer Dr W Unit 2
- 10856 Timer Dr W Unit 4
- 10854 Timer Dr W
- 10854 Timer Dr W Unit 3
- 10863 Timer Dr E
- 10848 Timer Dr W Unit 1
- 10844 Timer Dr W Unit 3
- 10840 Timer Dr W
- 10842 Timer Dr W Unit 4
- 10844 Timer Dr W Unit 4
- 11340 Timer Dr Unit 11340
- 10857 Timer Dr E Unit 4
- 10861 Timer Dr E Unit 3
- 10867 Timer Dr E Unit 1
- 11358 Timer Dr Unit 11358
- 10853 Timer Dr E Unit 5
- 10853 Timer Dr E Unit 1085
- 10847 Timer Dr E Unit 4
- 10835 Timer Dr E Unit 1
- 10843 Timer Dr E Unit 3
Your Personal Tour Guide
Ask me questions while you tour the home.