Estimated Value: $578,709 - $633,000
4
Beds
2
Baths
1,663
Sq Ft
$360/Sq Ft
Est. Value
About This Home
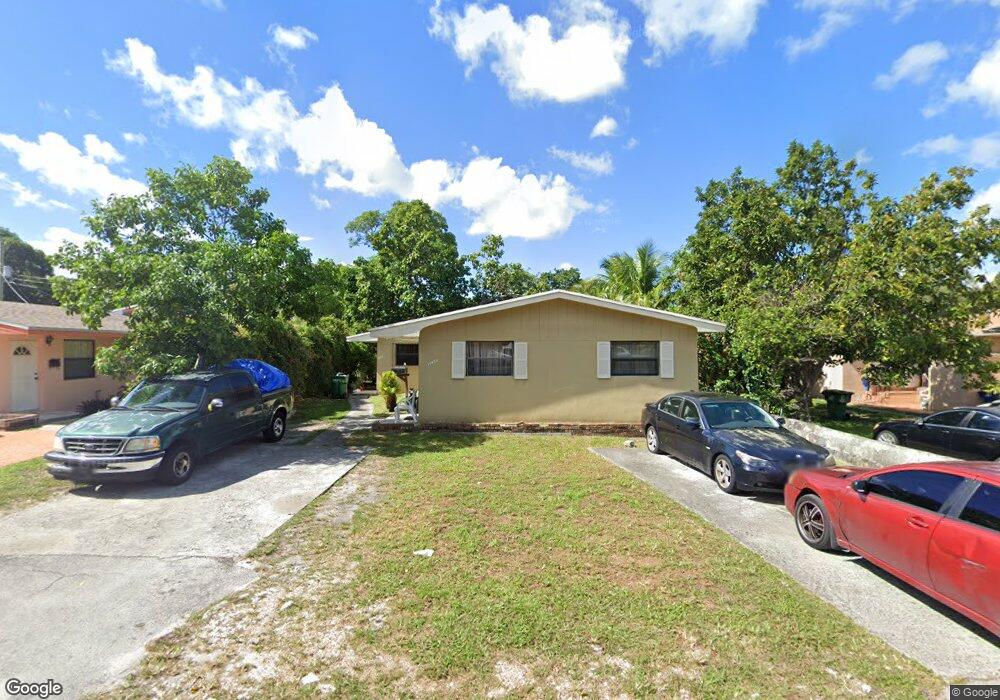
This home is located at 10852 NE 3rd Ave, Miami, FL 33161 and is currently estimated at $599,427, approximately $360 per square foot. 10852 NE 3rd Ave is a home located in Miami-Dade County with nearby schools including Miami Shores Elementary School, Horace Mann Middle School, and Miami Edison Senior High School.
Ownership History
Date
Name
Owned For
Owner Type
Purchase Details
Closed on
Apr 24, 2003
Sold by
Duverger Harry
Bought by
Christian Circee
Current Estimated Value
Home Financials for this Owner
Home Financials are based on the most recent Mortgage that was taken out on this home.
Original Mortgage
$134,850
Outstanding Balance
$58,101
Interest Rate
5.79%
Mortgage Type
Unknown
Estimated Equity
$541,326
Purchase Details
Closed on
Oct 18, 2002
Sold by
Gelin Eddy
Bought by
Sherman Richard
Purchase Details
Closed on
Oct 15, 2002
Sold by
Sherman Richard
Bought by
Light Of Hope Finl Svcs Inc
Purchase Details
Closed on
Aug 6, 1997
Sold by
Georges Marie
Bought by
Gelin Eddy and Cadet William
Home Financials for this Owner
Home Financials are based on the most recent Mortgage that was taken out on this home.
Original Mortgage
$87,900
Interest Rate
7.59%
Mortgage Type
FHA
Create a Home Valuation Report for This Property
The Home Valuation Report is an in-depth analysis detailing your home's value as well as a comparison with similar homes in the area
Home Values in the Area
Average Home Value in this Area
Purchase History
| Date | Buyer | Sale Price | Title Company |
|---|---|---|---|
| Christian Circee | $150,000 | Royal Title & Escrow Company | |
| Sherman Richard | $70,000 | -- | |
| Gelin Eddy | -- | -- | |
| Light Of Hope Finl Svcs Inc | $110,000 | -- | |
| Gelin Eddy | $88,000 | -- |
Source: Public Records
Mortgage History
| Date | Status | Borrower | Loan Amount |
|---|---|---|---|
| Open | Christian Circee | $134,850 | |
| Previous Owner | Gelin Eddy | $87,900 |
Source: Public Records
Tax History
| Year | Tax Paid | Tax Assessment Tax Assessment Total Assessment is a certain percentage of the fair market value that is determined by local assessors to be the total taxable value of land and additions on the property. | Land | Improvement |
|---|---|---|---|---|
| 2025 | $7,564 | $348,023 | -- | -- |
| 2024 | $6,717 | $316,385 | -- | -- |
| 2023 | $6,717 | $287,623 | $0 | $0 |
| 2022 | $5,960 | $261,476 | $0 | $0 |
| 2021 | $5,291 | $237,706 | $0 | $0 |
| 2020 | $4,906 | $230,661 | $118,818 | $111,843 |
| 2019 | $4,641 | $221,175 | $108,445 | $112,730 |
| 2018 | $4,289 | $217,075 | $103,457 | $113,618 |
| 2017 | $3,843 | $162,358 | $0 | $0 |
| 2016 | $3,565 | $147,599 | $0 | $0 |
| 2015 | $3,377 | $134,181 | $0 | $0 |
| 2014 | -- | $121,983 | $0 | $0 |
Source: Public Records
Map
Nearby Homes
- 10901 NE 3rd Ave
- 269 NE 110th Terrace
- 347 NE 110th St
- 10851 NE 2nd Ct
- 283 NE 111th St
- 237 NE 110th Terrace
- 210 NE 110th St
- 11201 NE 3rd Ave
- 281 NE 112th St
- 395 NE 112th St
- 177 NE 109th St
- 470 NE 110th St
- 480 NE 109th St
- 0 NE 4th Ave Unit F10552518
- 334 NE 107th St
- 10821 NE 5th Ave
- 210 NE 107th St
- 11420 NE 4th Ave
- 520 NE 111th St
- 425 NE 114th St
- 10848 NE 3rd Ave
- 292 NE 110th St
- 298 NE 110th Terrace
- 297 NE 110th Terrace
- 276 NE 110 St
- 276 NE 110th St Unit REAR
- 276 NE 110th St
- 10840 NE 3rd Ave
- 10855 NE 2nd Place
- 10851 NE 2nd Place
- 10850 NE 3rd Ave
- 274 NE 110th St
- 10830 NE 3rd Ave
- 10841 NE 2nd Place
- 324 NE 110th St
- 326 NE 110th St
- 10951 NE 3rd Ave
- 10951 NE 3rd Ave Unit 1
- 10837 NE 2nd Place Unit 10837
- 10837 NE 2nd Place Unit 10839
Your Personal Tour Guide
Ask me questions while you tour the home.