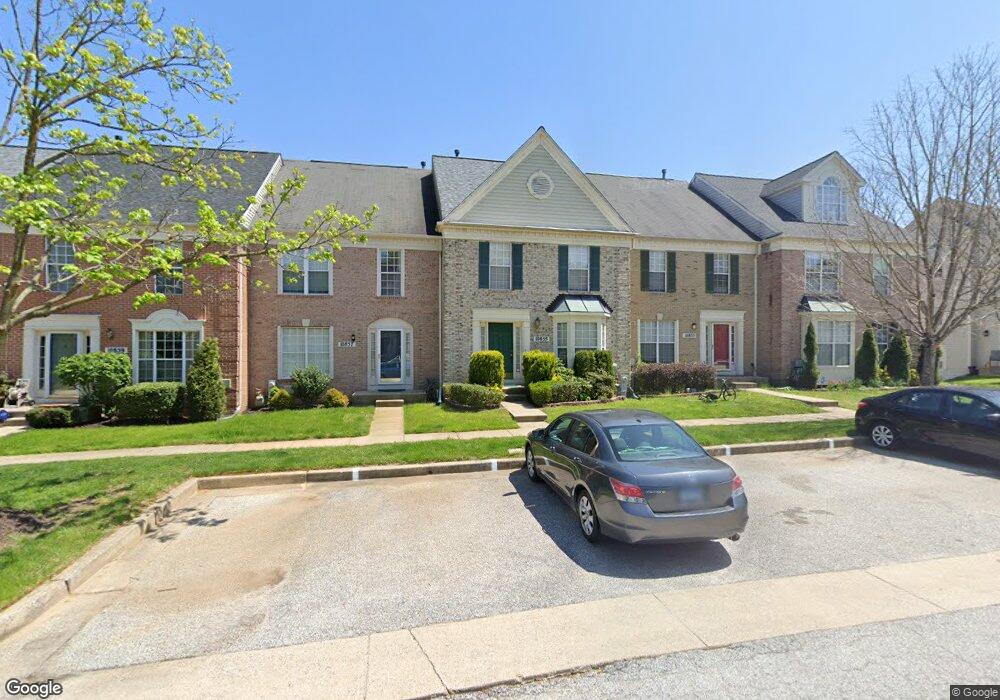
10855 Sherwood Hill Rd Owings Mills, MD 21117
Estimated Value: $371,647 - $419,000
--
Bed
3
Baths
1,702
Sq Ft
$229/Sq Ft
Est. Value
About This Home
This home is located at 10855 Sherwood Hill Rd, Owings Mills, MD 21117 and is currently estimated at $388,912, approximately $228 per square foot. 10855 Sherwood Hill Rd is a home located in Baltimore County with nearby schools including New Town Elementary School, Deer Park Middle Magnet School, and New Town High.
Ownership History
Date
Name
Owned For
Owner Type
Purchase Details
Closed on
Jun 27, 2024
Sold by
Akinmade Ernest Olufemi and Akinmade Aderemilekun Ayoka
Bought by
Akinmade Ernest Olufemi
Current Estimated Value
Purchase Details
Closed on
Jan 3, 2023
Sold by
Akinmade Aralola Bolito and Akinmade Ernest Olufemi
Bought by
Akinmade Ernest Olufemi and Akinmade Aderemilekun Ayoka
Purchase Details
Closed on
Apr 18, 2003
Sold by
Dalton Amy V
Bought by
Akinmade Ernest Olufemi and Akinmade Aralola Bolatito
Purchase Details
Closed on
Apr 27, 1999
Sold by
Dalton Amy V
Bought by
Dalton Amy
Purchase Details
Closed on
Jun 9, 1998
Sold by
Dalton Amy V
Bought by
Dalton Amy and Dalton David L
Purchase Details
Closed on
Nov 21, 1995
Sold by
Kotsher Paul S
Bought by
Dalton Amy and Dalton David L
Create a Home Valuation Report for This Property
The Home Valuation Report is an in-depth analysis detailing your home's value as well as a comparison with similar homes in the area
Home Values in the Area
Average Home Value in this Area
Purchase History
| Date | Buyer | Sale Price | Title Company |
|---|---|---|---|
| Akinmade Ernest Olufemi | -- | None Listed On Document | |
| Akinmade Ernest Olufemi | -- | None Listed On Document | |
| Akinmade Ernest Olufemi | -- | None Listed On Document | |
| Akinmade Ernest Olufemi | -- | None Listed On Document | |
| Akinmade Ernest Olufemi | $196,900 | -- | |
| Dalton Amy | -- | -- | |
| Dalton Amy | -- | -- | |
| Dalton Amy | $146,655 | -- |
Source: Public Records
Tax History Compared to Growth
Tax History
| Year | Tax Paid | Tax Assessment Tax Assessment Total Assessment is a certain percentage of the fair market value that is determined by local assessors to be the total taxable value of land and additions on the property. | Land | Improvement |
|---|---|---|---|---|
| 2025 | $4,327 | $305,100 | -- | -- |
| 2024 | $4,327 | $279,300 | $60,000 | $219,300 |
| 2023 | $2,089 | $272,467 | $0 | $0 |
| 2022 | $3,970 | $265,633 | $0 | $0 |
| 2021 | $3,492 | $258,800 | $60,000 | $198,800 |
| 2020 | $3,492 | $252,367 | $0 | $0 |
| 2019 | $3,378 | $245,933 | $0 | $0 |
| 2018 | $3,241 | $239,500 | $60,000 | $179,500 |
| 2017 | $3,008 | $224,667 | $0 | $0 |
| 2016 | $2,738 | $209,833 | $0 | $0 |
| 2015 | $2,738 | $195,000 | $0 | $0 |
| 2014 | $2,738 | $195,000 | $0 | $0 |
Source: Public Records
Map
Nearby Homes
- 10835 Will Painter Dr
- 9715 Reese Farm Rd
- 4751 Shellbark Rd
- 11 Bank Spring Ct
- 4701 Wainwright Cir
- 24 Bailey Ln
- 5002 Hollington Dr Unit 301
- 5004 Willow Branch Way Unit 203
- 5227 Wagon Shed Cir
- 5233 Wagon Shed Cir
- 5114 Wagon Shed Cir
- 5119 Spring Willow Ct
- 5206 Stone Shop Cir
- 9943 Middle Mill Dr
- 9839 Bale Ct
- 4828 Stone Shop Cir
- 9473 Ashlyn Cir
- 900 Red Brook Blvd Unit 101
- 9537 Tessa Ln
- 18 Hawk Rise Ln Unit 205
- 10857 Sherwood Hill Rd
- 10853 Sherwood Hill Rd
- 10859 Sherwood Hill Rd
- 10851 Sherwood Hill Rd
- 10861 Sherwood Hill Rd
- 10863 Sherwood Hill Rd
- 10847 Sherwood Hill Rd
- 10865 Sherwood Hill Rd
- 10845 Sherwood Hill Rd
- 10843 Sherwood Hill Rd
- 10869 Sherwood Hill Rd
- 10848 Sherwood Hill Rd
- 10846 Sherwood Hill Rd
- 10850 Sherwood Hill Rd
- 10844 Sherwood Hill Rd
- 10841 Sherwood Hill Rd
- 10852 Sherwood Hill Rd
- 10842 Sherwood Hill Rd
- 10854 Sherwood Hill Rd
- 10855 Will Painter Dr