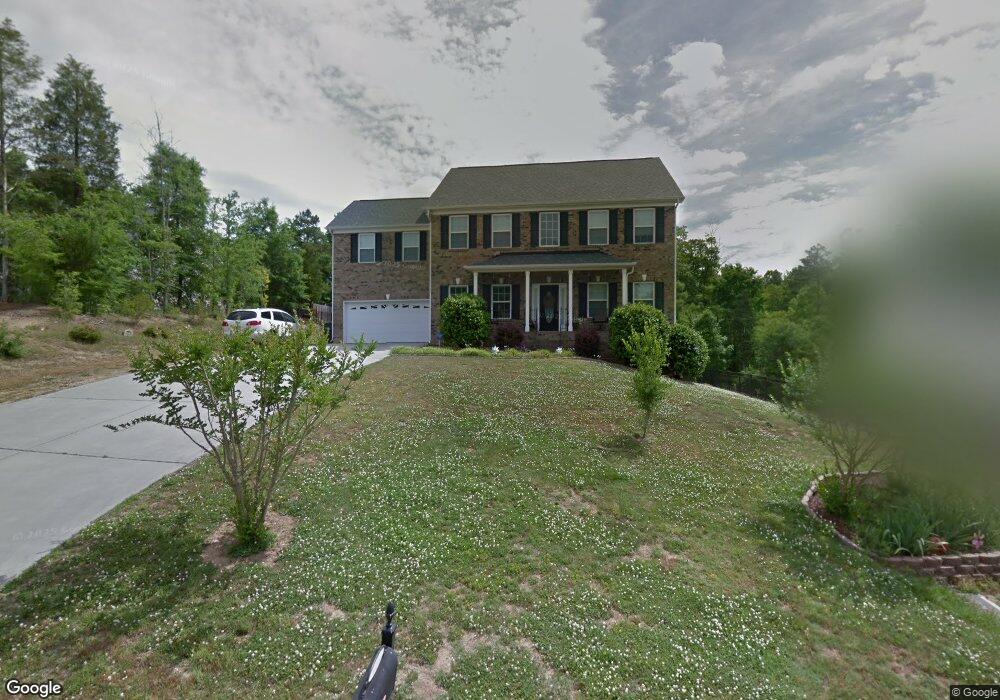
1086 Arrowhead Dr SE Concord, NC 28025
Estimated Value: $553,750 - $588,000
4
Beds
3
Baths
2,998
Sq Ft
$190/Sq Ft
Est. Value
About This Home
This home is located at 1086 Arrowhead Dr SE, Concord, NC 28025 and is currently estimated at $568,688, approximately $189 per square foot. 1086 Arrowhead Dr SE is a home located in Cabarrus County with nearby schools including W.M. Irvin Elementary School, Mount Pleasant Middle School, and Mount Pleasant High School.
Ownership History
Date
Name
Owned For
Owner Type
Purchase Details
Closed on
Jan 24, 2019
Sold by
Walton Tanner Matthew Gibson and Walton Tanner Kelly
Bought by
Gibson Tanner Matthew
Current Estimated Value
Home Financials for this Owner
Home Financials are based on the most recent Mortgage that was taken out on this home.
Original Mortgage
$236,800
Outstanding Balance
$196,258
Interest Rate
4.6%
Mortgage Type
New Conventional
Estimated Equity
$372,430
Purchase Details
Closed on
Sep 2, 2009
Sold by
Gold Medallion Homes Llc
Bought by
Tanner Matthew Gibson and Tanner Kelly Walton
Home Financials for this Owner
Home Financials are based on the most recent Mortgage that was taken out on this home.
Original Mortgage
$247,252
Interest Rate
5.14%
Mortgage Type
FHA
Purchase Details
Closed on
Aug 30, 2006
Sold by
Davis Land Group Llc
Bought by
Gold Medallion Homes Llc
Create a Home Valuation Report for This Property
The Home Valuation Report is an in-depth analysis detailing your home's value as well as a comparison with similar homes in the area
Home Values in the Area
Average Home Value in this Area
Purchase History
| Date | Buyer | Sale Price | Title Company |
|---|---|---|---|
| Gibson Tanner Matthew | -- | None Available | |
| Tanner Matthew Gibson | $253,000 | None Available | |
| Gold Medallion Homes Llc | $1,600,000 | None Available |
Source: Public Records
Mortgage History
| Date | Status | Borrower | Loan Amount |
|---|---|---|---|
| Open | Gibson Tanner Matthew | $236,800 | |
| Closed | Tanner Matthew Gibson | $247,252 |
Source: Public Records
Tax History Compared to Growth
Tax History
| Year | Tax Paid | Tax Assessment Tax Assessment Total Assessment is a certain percentage of the fair market value that is determined by local assessors to be the total taxable value of land and additions on the property. | Land | Improvement |
|---|---|---|---|---|
| 2025 | $4,730 | $474,920 | $100,000 | $374,920 |
| 2024 | $4,730 | $474,920 | $100,000 | $374,920 |
| 2023 | $3,599 | $295,020 | $56,250 | $238,770 |
| 2022 | $3,599 | $295,020 | $56,250 | $238,770 |
| 2021 | $3,599 | $295,020 | $56,250 | $238,770 |
| 2020 | $3,599 | $295,020 | $56,250 | $238,770 |
| 2019 | $3,185 | $261,070 | $37,500 | $223,570 |
| 2018 | $3,133 | $261,070 | $37,500 | $223,570 |
| 2017 | $3,081 | $261,070 | $37,500 | $223,570 |
| 2016 | $1,827 | $241,480 | $37,500 | $203,980 |
| 2015 | $2,849 | $241,480 | $37,500 | $203,980 |
| 2014 | $2,849 | $241,480 | $37,500 | $203,980 |
Source: Public Records
Map
Nearby Homes
- 1106 Setter Ln SE
- 153 Cottontail Ln SE Unit 46
- 1121 Setter Ln SE
- 51 Plott Dr SW
- 79 Cumberland Ct SW
- 46 Donna Dale Ave SE
- 6175 U S 601
- 2752 State Highway 49
- 2369 Baxter Place SE
- 2365 Baxter Place SE
- 1146 Crestmont Dr SE
- 2314 Fairport Dr SE
- 2625 Old Airport Rd
- 271 Ikerd Dr SE
- 1076 Tangle Ridge Dr SE
- 2406 Everton Cir SE
- 1197 Tangle Ridge Dr SE
- 768 Millbrook Ct
- 1128 Tangle Ridge Dr SE
- 780 Marble St SE
- 1090 Arrowhead Dr SE
- 1082 Arrowhead Dr SE
- 227 Seminole Ave SE
- 1094 Arrowhead Dr SE
- 1076 Arrowhead Dr SE
- 330 Creek Trail SE
- 223 Seminole Ave SE
- 390 Creek Trail SE
- 325 Creek Trail SE
- 318 Creek Trail SE
- 382 Creek Trail SE
- 1070 Arrowhead Dr SE
- 376 Creek Trail SE
- 222 Seminole Ave SE
- 370 Creek Trail SE
- 1065 Arrowhead Dr SE
- 362 Creek Trail SE
- 314 Creek Trail SE
- 375 Creek Trail SE
- 218 Seminole Ave SE