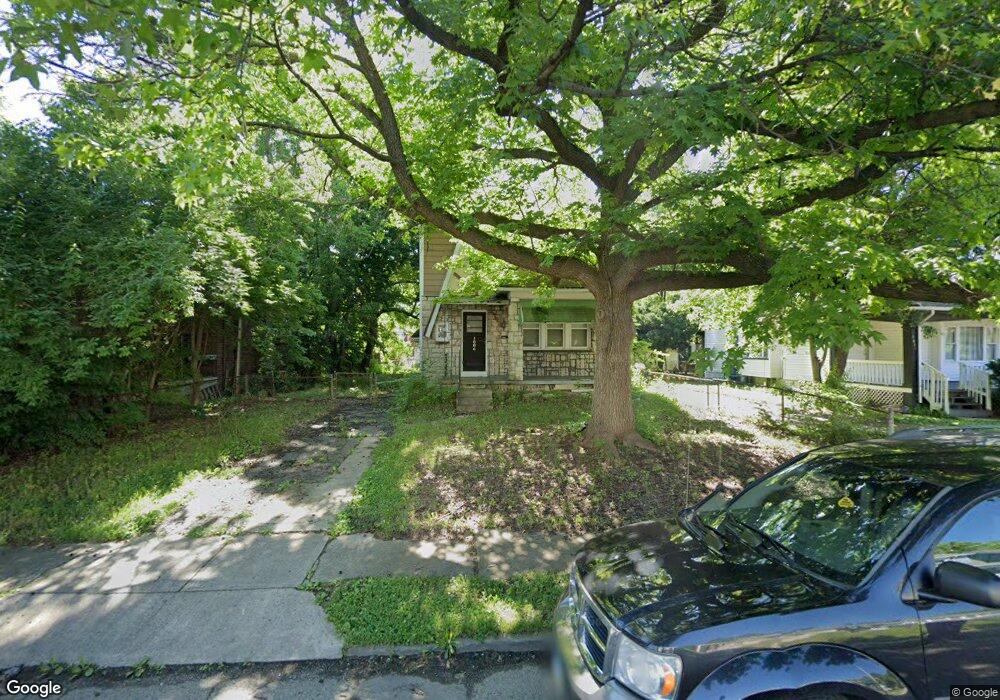
1086 Miller Ave Columbus, OH 43206
Driving Park NeighborhoodEstimated Value: $162,000 - $214,000
2
Beds
2
Baths
1,131
Sq Ft
$168/Sq Ft
Est. Value
About This Home
This home is located at 1086 Miller Ave, Columbus, OH 43206 and is currently estimated at $190,252, approximately $168 per square foot. 1086 Miller Ave is a home located in Franklin County with nearby schools including Fairwood Alternative Elementary School, South High School, and Capital Collegiate Preparatory Academy.
Ownership History
Date
Name
Owned For
Owner Type
Purchase Details
Closed on
Sep 30, 2019
Sold by
Phh Mortgage Corporation
Bought by
Goldberg Properties Llc
Current Estimated Value
Purchase Details
Closed on
Apr 3, 2012
Sold by
Turner Rachel L
Bought by
Citimortgage Inc
Purchase Details
Closed on
Dec 21, 2006
Sold by
Iacovetta Holdings Llc
Bought by
Turner Rachel L
Home Financials for this Owner
Home Financials are based on the most recent Mortgage that was taken out on this home.
Original Mortgage
$69,000
Interest Rate
6.24%
Mortgage Type
Purchase Money Mortgage
Purchase Details
Closed on
Jun 30, 2006
Sold by
Finch Dorothy
Bought by
Iacovetta Holdings Llc
Purchase Details
Closed on
Apr 18, 1984
Bought by
Finch Eugene M
Purchase Details
Closed on
Dec 1, 1983
Purchase Details
Closed on
Nov 1, 1983
Create a Home Valuation Report for This Property
The Home Valuation Report is an in-depth analysis detailing your home's value as well as a comparison with similar homes in the area
Home Values in the Area
Average Home Value in this Area
Purchase History
| Date | Buyer | Sale Price | Title Company |
|---|---|---|---|
| Goldberg Properties Llc | $51,200 | None Available | |
| Citimortgage Inc | $40,000 | None Available | |
| Turner Rachel L | $69,000 | Talon Group | |
| Iacovetta Holdings Llc | $40,200 | Fati | |
| Finch Eugene M | -- | -- | |
| -- | -- | -- | |
| -- | $39,600 | -- |
Source: Public Records
Mortgage History
| Date | Status | Borrower | Loan Amount |
|---|---|---|---|
| Previous Owner | Turner Rachel L | $69,000 |
Source: Public Records
Tax History
| Year | Tax Paid | Tax Assessment Tax Assessment Total Assessment is a certain percentage of the fair market value that is determined by local assessors to be the total taxable value of land and additions on the property. | Land | Improvement |
|---|---|---|---|---|
| 2025 | $2,679 | $54,330 | $11,520 | $42,810 |
| 2024 | $2,679 | $54,330 | $11,520 | $42,810 |
| 2023 | $2,785 | $54,330 | $11,520 | $42,810 |
| 2022 | $3,567 | $22,230 | $2,980 | $19,250 |
| 2021 | $1,401 | $22,230 | $2,980 | $19,250 |
| 2020 | $1,350 | $22,230 | $2,980 | $19,250 |
| 2019 | $1,264 | $18,350 | $2,490 | $15,860 |
| 2018 | $1,642 | $18,350 | $2,490 | $15,860 |
| 2017 | $3,336 | $18,350 | $2,490 | $15,860 |
| 2016 | $2,323 | $16,280 | $3,710 | $12,570 |
| 2015 | $1,839 | $16,280 | $3,710 | $12,570 |
| 2014 | $1,009 | $16,280 | $3,710 | $12,570 |
| 2013 | $373 | $19,145 | $4,375 | $14,770 |
Source: Public Records
Map
Nearby Homes
- 1062 Miller Ave
- 1038 Lockbourne Rd
- 980 Miller Ave
- 974 Miller Ave
- 959 Kelton Ave
- 1005 Studer Ave
- 928 Miller Ave
- 1451 1449 E Columbus St E
- 916 Miller Ave
- 940 Kelton Ave
- 901 Lockbourne Rd
- 915 Kelton Ave
- 1219 Berkeley Rd
- 957 Linwood Ave
- 940 Lilley Ave
- 895 Studer Ave
- 1223 Berkeley Rd
- 889 Kelton Ave
- 1029 Geers Ave
- 911 Linwood Ave Unit & 913
- 1082 Miller Ave
- 1088 Miller Ave
- 0 Miller Ave
- 1072 Miller Ave
- 954 Miller Ave
- 929 Miller Ave
- 1096 Miller Ave Unit 98
- 1091 Ellsworth Ave
- 1068 Miller Ave
- 1085 Ellsworth Ave
- 1097 Ellsworth Ave
- 1104 Miller Ave Unit 106
- 1064 Miller Ave
- 1103 Ellsworth Ave
- 1075 Ellsworth Ave
- 1110 Miller Ave Unit 112
- 1109 Ellsworth Ave
- 1110-1112 Miller Ave Unit 1112
- 1071 Ellsworth Ave
- 1087 Miller Ave
Your Personal Tour Guide
Ask me questions while you tour the home.