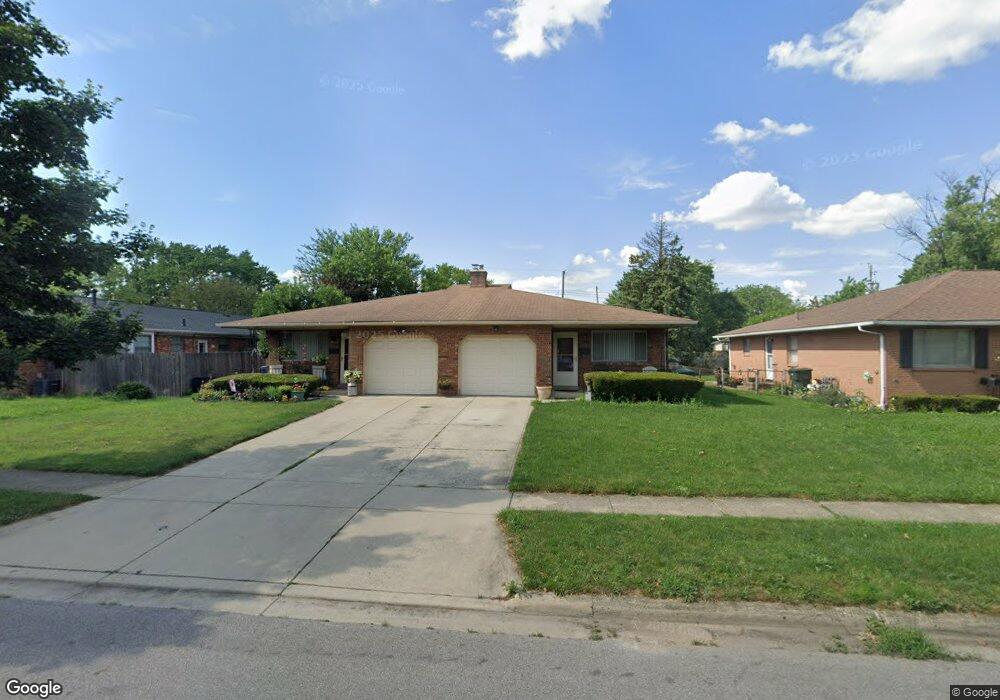
1086 Sagecrest Dr Unit 88 Columbus, OH 43229
Woodward Park NeighborhoodEstimated Value: $339,457 - $352,000
4
Beds
2
Baths
2,352
Sq Ft
$146/Sq Ft
Est. Value
About This Home
This home is located at 1086 Sagecrest Dr Unit 88, Columbus, OH 43229 and is currently estimated at $342,864, approximately $145 per square foot. 1086 Sagecrest Dr Unit 88 is a home located in Franklin County with nearby schools including Valley Forge Elementary School, Woodward Park Middle School, and Northland High School.
Ownership History
Date
Name
Owned For
Owner Type
Purchase Details
Closed on
Feb 26, 2021
Sold by
Kyle Gwen M and Kyle Jackson Alfreda
Bought by
Kyle Jackson Gwen and Kyle Jackson Alfreda
Current Estimated Value
Purchase Details
Closed on
Feb 7, 2001
Sold by
Galbraith Daniel W
Bought by
Kyle Gwen M
Home Financials for this Owner
Home Financials are based on the most recent Mortgage that was taken out on this home.
Original Mortgage
$141,592
Outstanding Balance
$51,528
Interest Rate
7.18%
Mortgage Type
FHA
Estimated Equity
$291,336
Purchase Details
Closed on
Aug 3, 1993
Bought by
Galbraith Daniel W
Purchase Details
Closed on
Jun 1, 1984
Create a Home Valuation Report for This Property
The Home Valuation Report is an in-depth analysis detailing your home's value as well as a comparison with similar homes in the area
Home Values in the Area
Average Home Value in this Area
Purchase History
| Date | Buyer | Sale Price | Title Company |
|---|---|---|---|
| Kyle Jackson Gwen | -- | None Available | |
| Kyle Gwen M | $155,000 | Chicago Title | |
| Galbraith Daniel W | $119,500 | -- | |
| -- | $97,000 | -- |
Source: Public Records
Mortgage History
| Date | Status | Borrower | Loan Amount |
|---|---|---|---|
| Open | Kyle Gwen M | $141,592 |
Source: Public Records
Tax History Compared to Growth
Tax History
| Year | Tax Paid | Tax Assessment Tax Assessment Total Assessment is a certain percentage of the fair market value that is determined by local assessors to be the total taxable value of land and additions on the property. | Land | Improvement |
|---|---|---|---|---|
| 2024 | $4,984 | $109,900 | $21,630 | $88,270 |
| 2023 | $4,921 | $109,900 | $21,630 | $88,270 |
| 2022 | $3,084 | $58,740 | $9,560 | $49,180 |
| 2021 | $3,090 | $58,740 | $9,560 | $49,180 |
| 2020 | $3,094 | $58,740 | $9,560 | $49,180 |
| 2019 | $2,885 | $46,970 | $7,630 | $39,340 |
| 2018 | $3,009 | $46,970 | $7,630 | $39,340 |
| 2017 | $2,884 | $46,970 | $7,630 | $39,340 |
| 2016 | $3,452 | $51,450 | $10,640 | $40,810 |
| 2015 | $3,138 | $51,450 | $10,640 | $40,810 |
| 2014 | $3,146 | $51,450 | $10,640 | $40,810 |
| 2013 | $1,706 | $56,560 | $11,235 | $45,325 |
Source: Public Records
Map
Nearby Homes
- 1116 Tulsa Dr
- 1125 Upland Dr
- 1071 Loring Rd
- 4904 Almont Dr
- 1266 Pershing Dr
- 4983 Almont Dr
- 4441 Wetmore Rd E
- 1414 Alvina Dr
- 4791 Bourke Rd
- 4815 Bourke Rd
- 4800 Bourke Rd
- 4816 Bourke Rd
- 4761 Colonel Perry Dr
- 1385 Thurell Rd
- 4455 Kenfield Rd
- 1191 Bryson Rd
- 4852 Colonel Perry Dr
- 1485 Norma Rd
- 1130 Carbone Dr
- 964 Strimple Ave
- 1094 Sagecrest Dr Unit 96
- 4770 Kingshill Dr Unit 772
- 4778 Kingshill Dr Unit 780
- 1106 Sagecrest Dr Unit 108
- 4790 Kingshill Dr Unit 792
- 1083 Sagecrest Dr Unit 85
- 1091 Sagecrest Dr Unit 93
- 1091 Sagecrest Dr Unit 1093
- 4738 Kingshill Dr Unit 740
- 1114 Sagecrest Dr Unit 116
- 1107 Dechant Ct
- 1103 Sagecrest Dr Unit 105
- 1103 Sagecrest Dr Unit 2
- 1115 Dechant Ct
- 4798 Kingshill Dr Unit 800
- 1111 Sagecrest Dr Unit 113
- 1126 Sagecrest Dr Unit 128
- 1126 Sagecrest Dr Unit O
- 4806 Kingshill Dr
- 1106 Dechant Ct