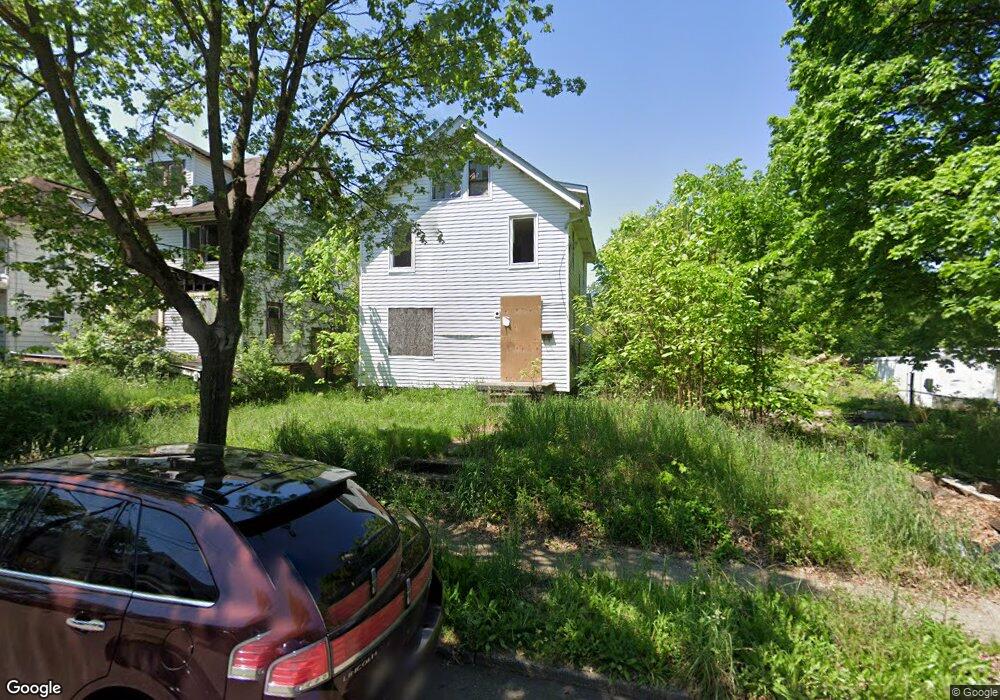
1086 Wilbur Ave Akron, OH 44301
South Akron NeighborhoodEstimated Value: $73,400 - $115,000
3
Beds
1
Bath
1,347
Sq Ft
$71/Sq Ft
Est. Value
About This Home
This home is located at 1086 Wilbur Ave, Akron, OH 44301 and is currently estimated at $96,100, approximately $71 per square foot. 1086 Wilbur Ave is a home located in Summit County with nearby schools including McEbright Elementary School, Kenmore Garfield Community Learning Center, and Main Preparatory Academy.
Ownership History
Date
Name
Owned For
Owner Type
Purchase Details
Closed on
Mar 24, 2023
Sold by
County Treasurer
Bought by
Fig and Fig Oh18 Llc
Current Estimated Value
Purchase Details
Closed on
May 30, 2019
Sold by
Mccoy Family Broderty Govenment Svcs Llc
Bought by
Macol Lamonta R
Purchase Details
Closed on
Jul 31, 2018
Sold by
Mccoy Lamonta R and Mccoy Lamonta R
Bought by
Mccoy And Family And Property Management
Purchase Details
Closed on
Dec 29, 2016
Sold by
Lakeside Reo Ventures Llc
Bought by
Mccoy Lamonta R
Purchase Details
Closed on
Jun 3, 2016
Sold by
Castle Rock 3 Llc
Bought by
Lakeside Reo Ventures Llc
Purchase Details
Closed on
Aug 8, 2011
Sold by
K B Development Ltd
Bought by
Castle Rock 3 Llc
Purchase Details
Closed on
Mar 31, 1999
Sold by
Bauch Kurt F
Bought by
K B Development Ltd
Purchase Details
Closed on
Dec 30, 1998
Sold by
Weekley Matthew B and Weekley Joanne A
Bought by
Bauch Kurt F
Create a Home Valuation Report for This Property
The Home Valuation Report is an in-depth analysis detailing your home's value as well as a comparison with similar homes in the area
Home Values in the Area
Average Home Value in this Area
Purchase History
| Date | Buyer | Sale Price | Title Company |
|---|---|---|---|
| Fig | -- | -- | |
| Macol Lamonta R | -- | None Available | |
| Mccoy And Family And Property Management | -- | None Available | |
| Mccoy Lamonta R | $2,000 | None Available | |
| Lakeside Reo Ventures Llc | -- | None Available | |
| Castle Rock 3 Llc | $6,300 | Diamond Title Co | |
| K B Development Ltd | -- | Falls Title Agency Inc | |
| Bauch Kurt F | -- | -- |
Source: Public Records
Tax History
| Year | Tax Paid | Tax Assessment Tax Assessment Total Assessment is a certain percentage of the fair market value that is determined by local assessors to be the total taxable value of land and additions on the property. | Land | Improvement |
|---|---|---|---|---|
| 2025 | $13,209 | $19,240 | $3,528 | $15,712 |
| 2024 | $13,209 | $19,240 | $3,528 | $15,712 |
| 2023 | $13,209 | $19,240 | $3,528 | $15,712 |
| 2022 | $1,052 | $12,411 | $2,275 | $10,136 |
| 2021 | $1,842 | $12,411 | $2,275 | $10,136 |
| 2020 | $2,105 | $12,420 | $2,280 | $10,140 |
| 2019 | $1,878 | $16,400 | $4,170 | $12,230 |
| 2018 | $1,999 | $16,400 | $4,170 | $12,230 |
| 2017 | $345 | $16,400 | $4,170 | $12,230 |
| 2016 | $3,031 | $16,680 | $4,170 | $12,510 |
| 2015 | $345 | $16,700 | $4,190 | $12,510 |
| 2014 | $1,321 | $16,700 | $4,190 | $12,510 |
| 2013 | $1,298 | $16,750 | $4,190 | $12,560 |
Source: Public Records
Map
Nearby Homes
- 413 Stanton Ave
- 1100 Beardsley St
- 1012 Kling St
- 436 Cole Ave
- 1153 Lily St
- 1051 Brown St
- 1215 Sherman St
- 1094 Dietz Ave
- 1241 Wilbur Ave
- 1133 Bellows St
- 568 Stanton Ave
- 1222 Lily St
- 543 Corice St
- 1212 Tulip St
- 555 Corice St
- 586 Morgan Ave
- 1137 Herberich Ave
- 1208 Bellows St Unit 1210
- 1290 Marcy St
- 1240 Tulip St
- 1086 Wilbur Ave
- 1090 Wilbur Ave
- 1094 Wilbur Ave
- 1098 Wilbur Ave
- 1085 Wilbur Ave
- 1089 Wilbur Ave
- 1072 Wilbur Ave
- 1079 Wilbur Ave
- 1097 Wilbur Ave
- 1075 Wilbur Ave
- 1071 Wilbur Ave
- 401 Stanton Ave
- 1066 Wilbur Ave
- 417 Stanton Ave
- 421 Stanton Ave
- 1056 Beardsley St
- 1061 Wilbur Ave
- 1061 Wilbur Ave
- 1058 Beardsley St
- 1042 Beardsley St
Your Personal Tour Guide
Ask me questions while you tour the home.