
Seller's Agent in 2022
Mark Wagner
Professional Leasing & Real Es
(309) 645-4001
75 in this area
395 Total Sales

Estimated Value: $472,000 - $491,000
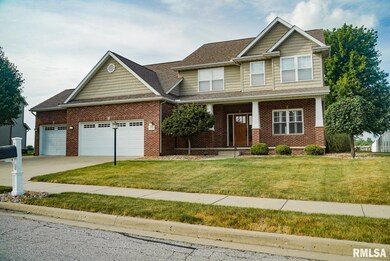
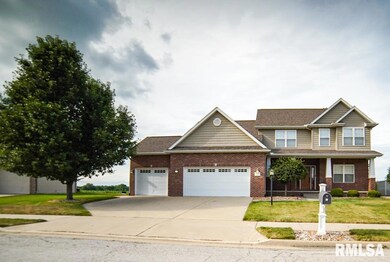
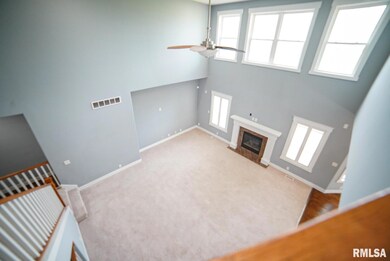
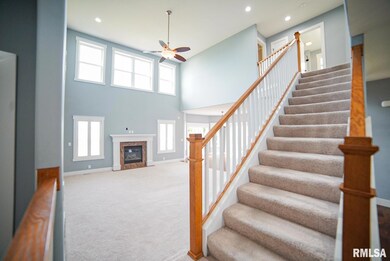
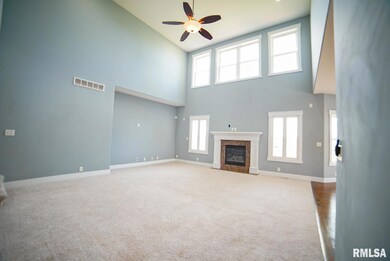
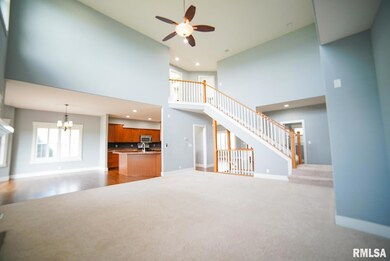
Located in the desirable Trail View Estates and Dunlap school district this five-bedroom 3.5 bathroom is perfect for entertaining. Kitchen features granite counter tops, lots of cabinet space, breakfast bar and informal dining with sliding doors that lead out to a freshly painted deck. Relax in the serenity of this private back yard view facing a beautiful big Midwestern cornfield. The main floor master suite has walk-in closet and bathroom featuring dual sinks, jetted tub and walk-in shower. Large basement is perfect to host your next party. It includes a bar, projector and screen as well as a fifth bedroom and full bathroom.
Last Agent to Sell the Property
Professional Leasing & Real Es License #471.004739 Listed on: 06/06/2022
| Date | Buyer | Sale Price | Title Company |
|---|---|---|---|
| Roberts Benjamin | $382,500 | -- | |
| Topping Kelly J | $364,500 | Chicago Title Co |
| Date | Status | Borrower | Loan Amount |
|---|---|---|---|
| Open | Roberts Benjamin | $369,734 |
| Date | Event | Price | List to Sale | Price per Sq Ft | Prior Sale |
|---|---|---|---|---|---|
| 12/16/2022 12/16/22 | Sold | $382,500 | -1.9% | $101 / Sq Ft | |
| 10/22/2022 10/22/22 | Pending | -- | -- | -- | |
| 10/19/2022 10/19/22 | Price Changed | $389,900 | -2.5% | $103 / Sq Ft | |
| 09/28/2022 09/28/22 | Price Changed | $399,900 | -1.2% | $105 / Sq Ft | |
| 08/23/2022 08/23/22 | Price Changed | $404,900 | -2.4% | $106 / Sq Ft | |
| 08/02/2022 08/02/22 | Price Changed | $414,900 | -3.5% | $109 / Sq Ft | |
| 06/06/2022 06/06/22 | For Sale | $429,900 | +17.9% | $113 / Sq Ft | |
| 06/18/2015 06/18/15 | Sold | $364,500 | -4.0% | $96 / Sq Ft | View Prior Sale |
| 05/20/2015 05/20/15 | Pending | -- | -- | -- | |
| 04/29/2015 04/29/15 | For Sale | $379,500 | -- | $100 / Sq Ft |
| Year | Tax Paid | Tax Assessment Tax Assessment Total Assessment is a certain percentage of the fair market value that is determined by local assessors to be the total taxable value of land and additions on the property. | Land | Improvement |
|---|---|---|---|---|
| 2024 | $11,058 | $133,170 | $24,040 | $109,130 |
| 2023 | $10,497 | $125,630 | $22,680 | $102,950 |
| 2022 | $9,681 | $115,320 | $21,440 | $93,880 |
| 2021 | $9,313 | $109,830 | $20,420 | $89,410 |
| 2020 | $9,114 | $106,640 | $19,830 | $86,810 |
| 2019 | $9,292 | $108,810 | $20,230 | $88,580 |
| 2018 | $9,502 | $112,000 | $20,610 | $91,390 |
| 2017 | $9,942 | $116,670 | $21,470 | $95,200 |
| 2016 | $10,536 | $127,450 | $21,470 | $105,980 |
| 2015 | $9,293 | $122,540 | $20,640 | $101,900 |
| 2014 | $9,113 | $112,530 | $20,950 | $91,580 |
| 2013 | -- | $110,320 | $20,540 | $89,780 |
Seller's Agent in 2022
Mark Wagner
Professional Leasing & Real Es
(309) 645-4001
75 in this area
395 Total Sales
Buyer's Agent in 2022
Jordan Myers
eXp Realty
(309) 648-3169
100 in this area
388 Total Sales
Seller's Agent in 2015
Marilyn Kohn
RE/MAX
(309) 696-7559
388 in this area
814 Total Sales
Buyer's Agent in 2015
Bill McCarthy
Coldwell Banker Real Estate Group
(309) 360-0012
31 in this area
49 Total Sales
Source: RMLS Alliance
MLS Number: RMAPA1234848
APN: 08-25-326-008
Disclaimer: Certain information contained herein is derived from information provided by parties other than Homes.com. All information provided is deemed reliable, but is not guaranteed to be accurate and should be independently verified.
![]() IDX information is provided exclusively for personal, non-commercial use, and may not be used for any purpose other than to identify prospective properties consumers may be interested in purchasing. Information is deemed reliable but not guaranteed.
IDX information is provided exclusively for personal, non-commercial use, and may not be used for any purpose other than to identify prospective properties consumers may be interested in purchasing. Information is deemed reliable but not guaranteed.