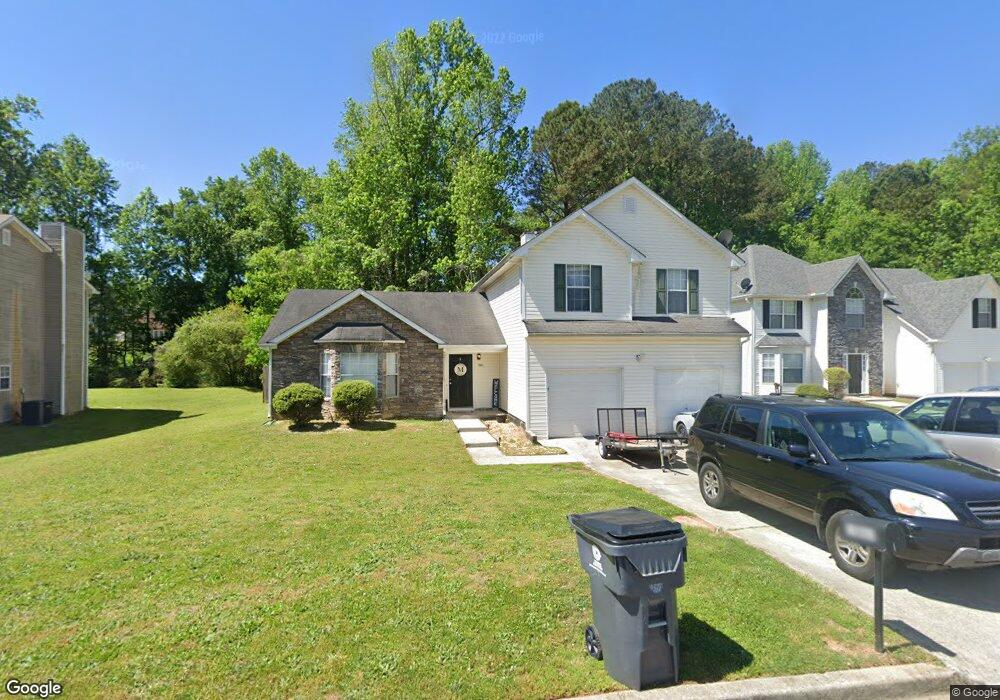
10863 Southshore Ct Hampton, GA 30228
Estimated Value: $239,000 - $293,000
3
Beds
3
Baths
2,109
Sq Ft
$127/Sq Ft
Est. Value
About This Home
This home is located at 10863 Southshore Ct, Hampton, GA 30228 and is currently estimated at $266,974, approximately $126 per square foot. 10863 Southshore Ct is a home located in Clayton County with nearby schools including Kemp Primary School, Kemp Elementary School, and Lovejoy Middle School.
Ownership History
Date
Name
Owned For
Owner Type
Purchase Details
Closed on
Mar 30, 2017
Sold by
Firebird Sfe I Llc
Bought by
Home Sfr Borrower Ii Llc and C/O Altisource Asset Managemen
Current Estimated Value
Purchase Details
Closed on
Feb 2, 2016
Sold by
Wallace Kawoska
Bought by
Firebird Sfe I Llc
Purchase Details
Closed on
Feb 7, 2006
Sold by
Household Realty Corp
Bought by
Wallace Kawoska
Home Financials for this Owner
Home Financials are based on the most recent Mortgage that was taken out on this home.
Original Mortgage
$105,600
Interest Rate
6.14%
Mortgage Type
New Conventional
Purchase Details
Closed on
Nov 1, 2005
Sold by
Stacey Joe
Bought by
Household Realty Corp
Purchase Details
Closed on
Oct 31, 2002
Sold by
Mathis Edward and Mathis Michelle E
Bought by
Stacey Joe
Home Financials for this Owner
Home Financials are based on the most recent Mortgage that was taken out on this home.
Original Mortgage
$129,000
Interest Rate
8.35%
Mortgage Type
New Conventional
Create a Home Valuation Report for This Property
The Home Valuation Report is an in-depth analysis detailing your home's value as well as a comparison with similar homes in the area
Home Values in the Area
Average Home Value in this Area
Purchase History
| Date | Buyer | Sale Price | Title Company |
|---|---|---|---|
| Home Sfr Borrower Ii Llc | $1,168,694 | -- | |
| Firebird Sfe I Llc | $66,000 | -- | |
| Wallace Kawoska | $132,000 | -- | |
| Household Realty Corp | $117,334 | -- | |
| Stacey Joe | $129,000 | -- |
Source: Public Records
Mortgage History
| Date | Status | Borrower | Loan Amount |
|---|---|---|---|
| Previous Owner | Wallace Kawoska | $105,600 | |
| Previous Owner | Stacey Joe | $129,000 |
Source: Public Records
Tax History Compared to Growth
Tax History
| Year | Tax Paid | Tax Assessment Tax Assessment Total Assessment is a certain percentage of the fair market value that is determined by local assessors to be the total taxable value of land and additions on the property. | Land | Improvement |
|---|---|---|---|---|
| 2024 | $4,875 | $124,000 | $7,200 | $116,800 |
| 2023 | $4,195 | $115,120 | $7,200 | $107,920 |
| 2022 | $2,550 | $64,000 | $7,200 | $56,800 |
| 2021 | $2,566 | $64,000 | $7,200 | $56,800 |
| 2020 | $2,598 | $64,000 | $7,200 | $56,800 |
| 2019 | $2,355 | $57,073 | $6,800 | $50,273 |
| 2018 | $1,928 | $46,550 | $6,098 | $40,452 |
| 2017 | $1,112 | $26,400 | $6,800 | $19,600 |
| 2016 | $1,195 | $45,217 | $6,800 | $38,417 |
| 2015 | $1,245 | $0 | $0 | $0 |
| 2014 | $936 | $32,552 | $6,800 | $25,752 |
Source: Public Records
Map
Nearby Homes
- 10959 Thrasher Rd
- 1741 Portwest Way
- 11005 Regents Ct
- 10996 Shannon Cir
- 1683 Spoonbill Rd
- 11045 Knotty Pine Place
- 1685 Kinglet Rd
- 11059 Sedalia Way
- 11057 Aliyah Dr
- 1739 Cardinal Rd
- 1432 Shadow Creek Ave
- 11179 Knotty Pine Place Unit I
- 10664 Sandpiper Rd
- 1579 Leonard St
- 1558 Leonard St
- 11187 Shannon Cir
- 1350 Birdsong Ln
- 10897 Paladin Dr
- 11224 Aliyah Dr
- 1380 Pebble Beach Ln Unit 2
- 10857 Southshore Ct
- 10869 Southshore Ct
- 10875 Southshore Ct
- 10888 Knotty Pine Place
- 10850 Southshore Ct Unit 98
- 10850 Southshore Ct
- 10881 Southshore Ct Unit 3
- 10881 Southshore Ct
- 10845 Southshore Ct Unit 3
- 10894 Knotty Pine Place
- 10851 Southshore Ct
- 10851 Southshore Ct
- 10851 Southshore Ct Unit 108
- 10876 Southshore Ct
- 10882 Knotty Pine Place
- 10900 Knotty Pine Place Unit II
- 10837 Southshore Ct Unit 3
- 10844 Southshore Ct
- 10876 Knotty Pine Place
- 10884 Southshore Ct