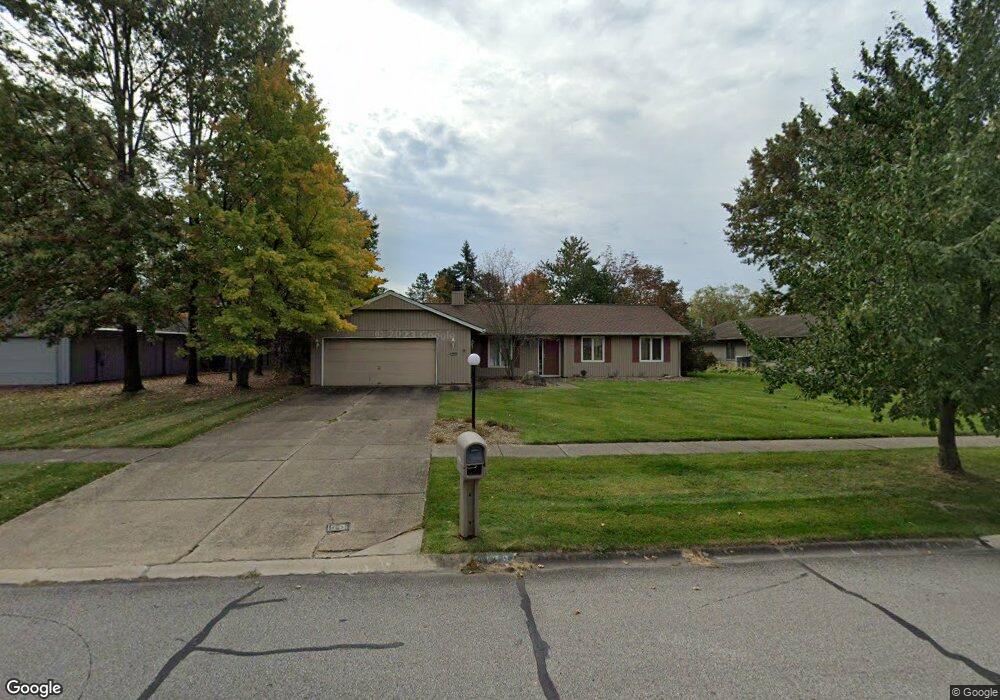
10869 Fence Row Dr Strongsville, OH 44149
Estimated Value: $318,872 - $367,000
3
Beds
2
Baths
1,935
Sq Ft
$173/Sq Ft
Est. Value
About This Home
This home is located at 10869 Fence Row Dr, Strongsville, OH 44149 and is currently estimated at $333,968, approximately $172 per square foot. 10869 Fence Row Dr is a home located in Cuyahoga County with nearby schools including Strongsville High School and Sts Joseph & John Interparochial School.
Ownership History
Date
Name
Owned For
Owner Type
Purchase Details
Closed on
Jul 14, 2005
Sold by
Shannon Joseph R
Bought by
Merrill Erin K
Current Estimated Value
Home Financials for this Owner
Home Financials are based on the most recent Mortgage that was taken out on this home.
Original Mortgage
$167,300
Outstanding Balance
$87,502
Interest Rate
5.69%
Mortgage Type
Fannie Mae Freddie Mac
Estimated Equity
$246,466
Purchase Details
Closed on
Aug 5, 1988
Sold by
Campbell Dennis C and Campbell Lynn H
Bought by
Shannon Joseph R
Purchase Details
Closed on
Dec 28, 1984
Sold by
Pranka Reid Michael and Pranka Sarah
Bought by
Campbell Dennis C and Campbell Lynn H
Purchase Details
Closed on
Sep 8, 1978
Bought by
Title Guarantee & Trust
Purchase Details
Closed on
Jan 1, 1977
Bought by
Bob Schmitt Homes Inc
Create a Home Valuation Report for This Property
The Home Valuation Report is an in-depth analysis detailing your home's value as well as a comparison with similar homes in the area
Home Values in the Area
Average Home Value in this Area
Purchase History
| Date | Buyer | Sale Price | Title Company |
|---|---|---|---|
| Merrill Erin K | $172,500 | Signature Title | |
| Shannon Joseph R | $109,000 | -- | |
| Campbell Dennis C | $87,500 | -- | |
| Pranka Reid Michael | -- | -- | |
| Title Guarantee & Trust | -- | -- | |
| Bob Schmitt Homes Inc | -- | -- |
Source: Public Records
Mortgage History
| Date | Status | Borrower | Loan Amount |
|---|---|---|---|
| Open | Merrill Erin K | $167,300 |
Source: Public Records
Tax History Compared to Growth
Tax History
| Year | Tax Paid | Tax Assessment Tax Assessment Total Assessment is a certain percentage of the fair market value that is determined by local assessors to be the total taxable value of land and additions on the property. | Land | Improvement |
|---|---|---|---|---|
| 2024 | $4,291 | $91,385 | $20,405 | $70,980 |
| 2023 | $4,533 | $72,390 | $17,750 | $54,640 |
| 2022 | $4,500 | $72,380 | $17,750 | $54,640 |
| 2021 | $4,464 | $72,380 | $17,750 | $54,640 |
| 2020 | $4,427 | $63,490 | $15,580 | $47,920 |
| 2019 | $4,297 | $181,400 | $44,500 | $136,900 |
| 2018 | $3,819 | $63,490 | $15,580 | $47,920 |
| 2017 | $3,809 | $57,410 | $13,900 | $43,510 |
| 2016 | $3,778 | $57,410 | $13,900 | $43,510 |
| 2015 | $3,719 | $57,410 | $13,900 | $43,510 |
| 2014 | $3,719 | $55,730 | $13,480 | $42,250 |
Source: Public Records
Map
Nearby Homes
- 10842 Fence Row Dr
- 10824 Watercress Rd
- 11030 Southwind Ct
- 10800 Meadow Trail
- 0 Priem Rd
- 22300 Rock Creek Cir
- 10008 Plum Brook Ln
- 12515 Countryside Dr
- 9829 Plum Brook Ln
- 10353 Oak Branch Trail
- 9598 Pebble Brook Ln
- 21359 Briar Bush Ln
- 8746 Barton Dr
- 12579 Woodberry Ln
- 21292 Creekside Dr
- 9384 N Marks Rd
- 12490 Challenge Way
- 21469 Woodview Cir
- 12665 Challenge Way
- 10839 Prospect Rd
- 10873 Fence Row Dr
- 10865 Fence Row Dr
- 10877 Fence Row Dr
- 10839 Watercress Rd
- 10861 Fence Row Dr
- 11028 Westwind Ct
- 10835 Watercress Rd
- 10832 Watercress Rd
- 10843 Gate Post Rd
- 10847 Gate Post Rd
- 11030 Westwind Ct
- 10857 Fence Row Dr
- 11032 Westwind Ct
- 10846 Fence Row Dr
- 10839 Gate Post Rd
- 11034 Westwind Ct
- 10828 Watercress Rd
- 10831 Watercress Rd
- 11036 Westwind Ct
- 10853 Fence Row Dr