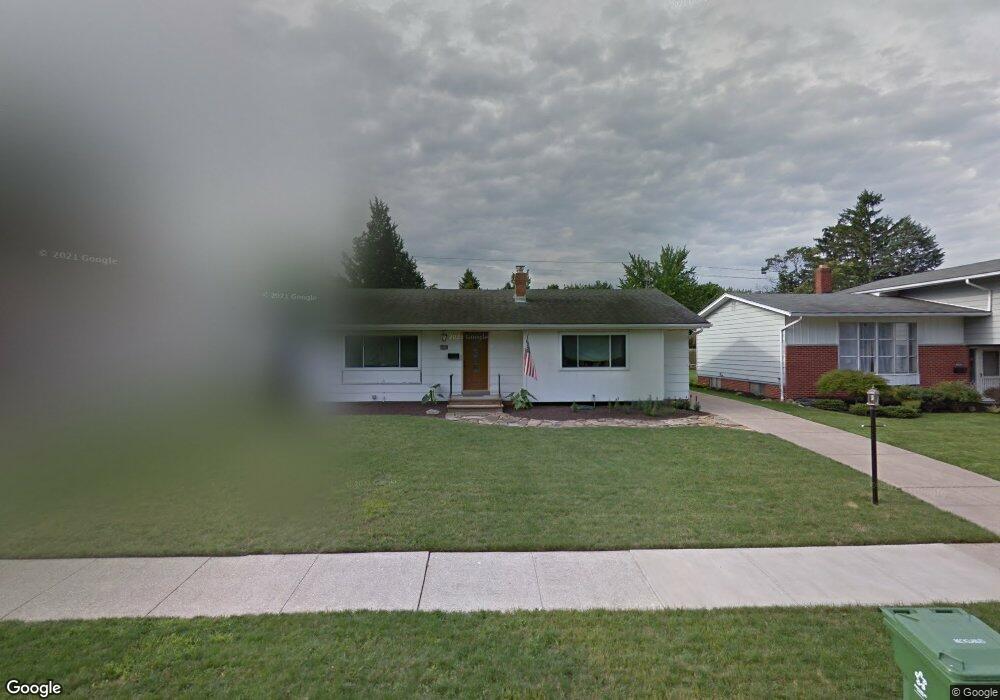
10869 Lafayette Dr Parma Heights, OH 44130
Estimated Value: $236,000 - $250,000
3
Beds
2
Baths
1,352
Sq Ft
$179/Sq Ft
Est. Value
About This Home
This home is located at 10869 Lafayette Dr, Parma Heights, OH 44130 and is currently estimated at $241,893, approximately $178 per square foot. 10869 Lafayette Dr is a home located in Cuyahoga County with nearby schools including Greenbriar Middle School, Pleasant Valley Elementary School, and Valley Forge High School.
Ownership History
Date
Name
Owned For
Owner Type
Purchase Details
Closed on
Jul 21, 2005
Sold by
Herron James F and Herron Linda L
Bought by
Miller Denise
Current Estimated Value
Home Financials for this Owner
Home Financials are based on the most recent Mortgage that was taken out on this home.
Original Mortgage
$100,800
Outstanding Balance
$52,619
Interest Rate
5.66%
Mortgage Type
Fannie Mae Freddie Mac
Estimated Equity
$189,274
Purchase Details
Closed on
Jan 23, 1984
Sold by
Bash Mary M
Bought by
Herron James F and Herron Linda L
Purchase Details
Closed on
Aug 8, 1983
Sold by
Bash Chester C
Bought by
Bash Mary M
Purchase Details
Closed on
Nov 8, 1978
Sold by
Docktor Albert F and Docktor Wilma D
Bought by
Bash Chester C
Purchase Details
Closed on
Jan 1, 1975
Bought by
Docktor Albert F and Docktor Wilma D
Create a Home Valuation Report for This Property
The Home Valuation Report is an in-depth analysis detailing your home's value as well as a comparison with similar homes in the area
Home Values in the Area
Average Home Value in this Area
Purchase History
| Date | Buyer | Sale Price | Title Company |
|---|---|---|---|
| Miller Denise | $126,000 | Executive Title Agency | |
| Herron James F | $65,500 | -- | |
| Bash Mary M | -- | -- | |
| Bash Chester C | $65,000 | -- | |
| Docktor Albert F | -- | -- |
Source: Public Records
Mortgage History
| Date | Status | Borrower | Loan Amount |
|---|---|---|---|
| Open | Miller Denise | $100,800 |
Source: Public Records
Tax History Compared to Growth
Tax History
| Year | Tax Paid | Tax Assessment Tax Assessment Total Assessment is a certain percentage of the fair market value that is determined by local assessors to be the total taxable value of land and additions on the property. | Land | Improvement |
|---|---|---|---|---|
| 2024 | $4,296 | $67,165 | $13,195 | $53,970 |
| 2023 | $3,722 | $50,120 | $10,920 | $39,200 |
| 2022 | $3,701 | $50,120 | $10,920 | $39,200 |
| 2021 | $3,728 | $50,120 | $10,920 | $39,200 |
| 2020 | $3,363 | $40,430 | $8,820 | $31,610 |
| 2019 | $3,272 | $115,500 | $25,200 | $90,300 |
| 2018 | $3,290 | $40,430 | $8,820 | $31,610 |
| 2017 | $3,398 | $39,520 | $8,160 | $31,360 |
| 2016 | $3,373 | $39,520 | $8,160 | $31,360 |
| 2015 | $3,358 | $39,520 | $8,160 | $31,360 |
| 2014 | $3,358 | $39,520 | $8,160 | $31,360 |
Source: Public Records
Map
Nearby Homes
- 6630 York Rd
- 10438 N Church Dr
- 10839 Tiffany Ln
- 6375 Sherborn Rd
- 11609 Lawndale Dr
- 11770 Barrington Blvd
- 9999 W Ridgewood Dr
- 6842 Greenbriar Dr
- 11533 Meadowbrook Dr
- 6436 Olde York Rd
- 6525 Aylesworth Dr
- 6697 Parma Park Blvd
- 6359 Olde York Rd Unit 6359
- 7014 Orchard Blvd
- 6996 Greenbriar Dr
- 6963 Anthony Ln
- 6400 Stratford Dr
- 7032 Brandywine Rd
- 8963 Lynnhaven Rd
- 6418 Newland Rd
- 10883 Lafayette Dr
- 10847 Lafayette Dr
- 10915 Lafayette Dr
- 10811 Lafayette Dr
- 10850 Blossom Ave
- 10870 Blossom Ave
- 6745 Crenshaw Dr
- 10830 Blossom Ave
- 10912 Blossom Ave
- 10793 Lafayette Dr
- 10959 Lafayette Dr
- 10810 Blossom Ave
- 6744 Crenshaw Dr
- 6739 Crenshaw Dr
- 10938 Blossom Ave
- 10790 Blossom Ave
- 10983 Lafayette Dr
- 10824 Lafayette Dr
- 10775 Lafayette Dr
- 10962 Blossom Ave