Estimated Value: $376,979
4
Beds
4
Baths
3,200
Sq Ft
$118/Sq Ft
Est. Value
About This Home
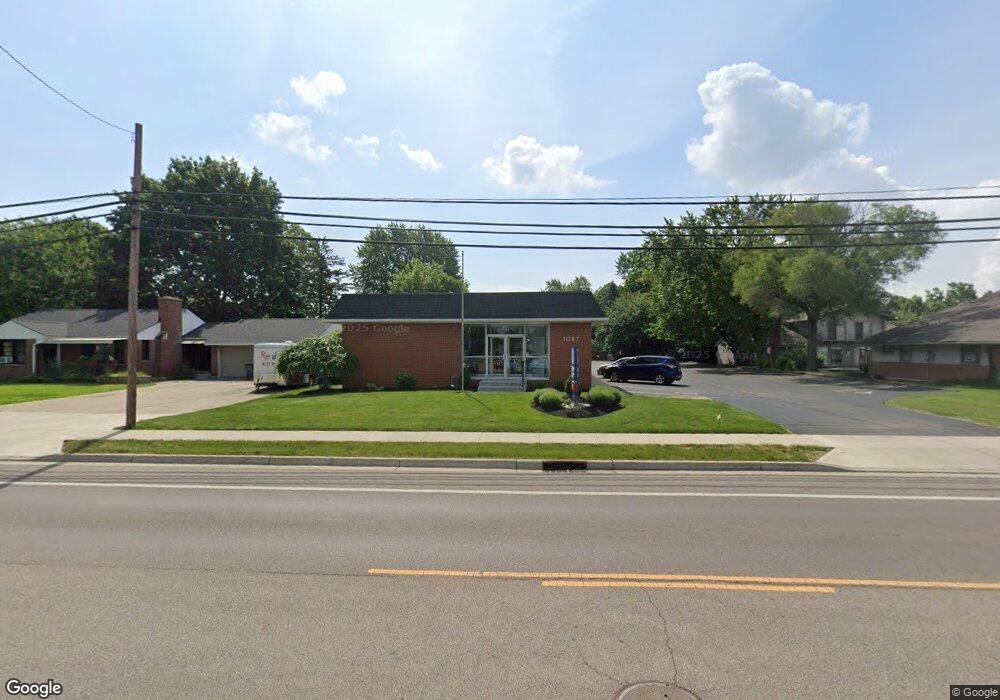
This home is located at 1087 N Market St, Troy, OH 45373 and is currently estimated at $376,979, approximately $117 per square foot. 1087 N Market St is a home located in Miami County with nearby schools including Cookson Elementary School, Troy Junior High School, and Van Cleve Elementary School.
Ownership History
Date
Name
Owned For
Owner Type
Purchase Details
Closed on
May 31, 2002
Sold by
The Miami Mutual Insurance Company
Bought by
Midwestern Ohio Assn Of Realtors Inc
Current Estimated Value
Home Financials for this Owner
Home Financials are based on the most recent Mortgage that was taken out on this home.
Original Mortgage
$100,000
Outstanding Balance
$42,849
Interest Rate
7%
Mortgage Type
Commercial
Estimated Equity
$334,130
Purchase Details
Closed on
Jan 1, 1990
Bought by
Miami Mutual Ins Co
Create a Home Valuation Report for This Property
The Home Valuation Report is an in-depth analysis detailing your home's value as well as a comparison with similar homes in the area
Home Values in the Area
Average Home Value in this Area
Purchase History
| Date | Buyer | Sale Price | Title Company |
|---|---|---|---|
| Midwestern Ohio Assn Of Realtors Inc | $180,000 | -- | |
| Miami Mutual Ins Co | -- | -- |
Source: Public Records
Mortgage History
| Date | Status | Borrower | Loan Amount |
|---|---|---|---|
| Open | Midwestern Ohio Assn Of Realtors Inc | $100,000 |
Source: Public Records
Tax History Compared to Growth
Tax History
| Year | Tax Paid | Tax Assessment Tax Assessment Total Assessment is a certain percentage of the fair market value that is determined by local assessors to be the total taxable value of land and additions on the property. | Land | Improvement |
|---|---|---|---|---|
| 2024 | $4,103 | $70,010 | $32,240 | $37,770 |
| 2023 | $4,103 | $70,010 | $32,240 | $37,770 |
| 2022 | $3,696 | $70,010 | $32,240 | $37,770 |
| 2021 | $3,740 | $70,010 | $32,240 | $37,770 |
| 2020 | $3,700 | $70,010 | $32,240 | $37,770 |
| 2019 | $3,709 | $70,010 | $32,240 | $37,770 |
| 2018 | $3,284 | $61,540 | $28,670 | $32,870 |
| 2017 | $3,283 | $61,540 | $28,670 | $32,870 |
| 2016 | $3,266 | $61,540 | $28,670 | $32,870 |
| 2015 | $3,244 | $61,540 | $28,670 | $32,870 |
| 2014 | $3,244 | $61,540 | $28,670 | $32,870 |
| 2013 | $3,237 | $61,540 | $28,670 | $32,870 |
Source: Public Records
Map
Nearby Homes
- 1075 Crestview Dr
- 190 Robin Hood Ln
- 731 Michigan Ave
- 708 N Market St
- 605 Ohio Ave
- 221 Finsbury Ln
- 755 W Bentley Cir
- 1329 Lee Rd
- 1160 Waterloo St
- 1164 Waterloo St
- 838 W Bentley Cir
- 1002 Stonyridge Ave
- 1137 Auburn St
- 1188 E Bentley Cir
- 813 W Bentley Cir
- 720 Sherwood Dr
- 429 Forrest Ln
- 922 Haverhill Dr
- 546 Loxley Ln
- 1105 N Market St
- 1090 Greenfield Dr
- 1080 Greenfield Dr
- 1098 Greenfield Dr
- 1135 N Market St
- 1070 Greenfield Dr
- 1136 Greenfield Dr
- 1010 N Market St
- 1161 N Market St
- 1122 N Market St
- 1040 Greenfield Dr
- 1150 Greenfield Dr
- 995, 997 North Market St
- 1150 N Market St
- 1093 Greenfield Dr
- 1181 N Market St
- 22 Denby Place
- 1085 Greenfield Dr
- 23 Denby Place
- 1026 Greenfield Dr