Estimated Value: $237,000 - $340,000
--
Bed
2
Baths
1,200
Sq Ft
$248/Sq Ft
Est. Value
About This Home
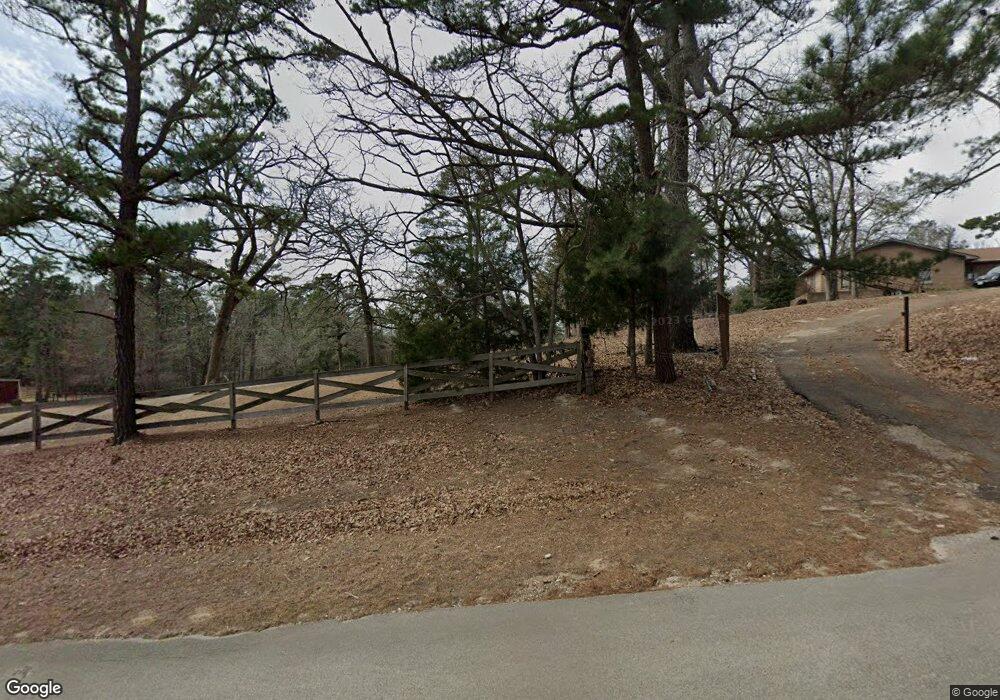
This home is located at 10876 County Road 290, Tyler, TX 75707 and is currently estimated at $297,984, approximately $248 per square foot. 10876 County Road 290 is a home located in Smith County with nearby schools including Kissam Intermediate School, Jackson Elementary School, and Chapel Hill Middle School.
Ownership History
Date
Name
Owned For
Owner Type
Purchase Details
Closed on
Jul 15, 2008
Sold by
Whitaker Casey and Reynolds Kobin
Bought by
Landry David and Landry Jane
Current Estimated Value
Home Financials for this Owner
Home Financials are based on the most recent Mortgage that was taken out on this home.
Original Mortgage
$115,000
Outstanding Balance
$73,946
Interest Rate
6.09%
Mortgage Type
Purchase Money Mortgage
Estimated Equity
$224,038
Purchase Details
Closed on
Aug 26, 2005
Sold by
Bolton William C and Bolton Bernice B
Bought by
Whitaker Casey
Home Financials for this Owner
Home Financials are based on the most recent Mortgage that was taken out on this home.
Original Mortgage
$103,500
Interest Rate
7.37%
Mortgage Type
Adjustable Rate Mortgage/ARM
Create a Home Valuation Report for This Property
The Home Valuation Report is an in-depth analysis detailing your home's value as well as a comparison with similar homes in the area
Home Values in the Area
Average Home Value in this Area
Purchase History
| Date | Buyer | Sale Price | Title Company |
|---|---|---|---|
| Landry David | -- | None Available | |
| Whitaker Casey | -- | None Available |
Source: Public Records
Mortgage History
| Date | Status | Borrower | Loan Amount |
|---|---|---|---|
| Open | Landry David | $115,000 | |
| Previous Owner | Whitaker Casey | $103,500 |
Source: Public Records
Tax History Compared to Growth
Tax History
| Year | Tax Paid | Tax Assessment Tax Assessment Total Assessment is a certain percentage of the fair market value that is determined by local assessors to be the total taxable value of land and additions on the property. | Land | Improvement |
|---|---|---|---|---|
| 2025 | $603 | $230,155 | $95,845 | $134,310 |
| 2024 | $603 | $227,116 | $94,165 | $136,116 |
| 2023 | $583 | $250,743 | $94,165 | $156,578 |
| 2022 | $3,001 | $223,866 | $84,836 | $139,030 |
| 2021 | $2,907 | $173,711 | $70,697 | $103,014 |
| 2020 | $2,754 | $173,711 | $70,697 | $103,014 |
| 2019 | $2,612 | $166,972 | $70,697 | $96,275 |
| 2018 | $2,365 | $157,156 | $70,697 | $86,459 |
| 2017 | $2,161 | $116,546 | $36,468 | $80,078 |
| 2016 | $2,119 | $114,240 | $36,468 | $77,772 |
| 2015 | $1,571 | $111,431 | $36,468 | $74,963 |
| 2014 | $1,571 | $109,239 | $36,468 | $72,771 |
Source: Public Records
Map
Nearby Homes
- 13332 White Tail Dr
- 13310 White Tail Dr
- 13311 White Tail Dr
- 13311 White Tail Dr Unit 1
- 13807 County Road 220
- 13800 County Road 220
- 10788 County Road 225
- 10908 & 10914 County Road 225
- 13594 State Highway 64 E
- 14951 County Road 2205
- 0000 State Highway 64
- 10789 County Road 214
- 9961 Creek Bend Dr
- 10680 County Road 214
- 7789 Lakeshore Dr
- 11452 County Road 2326
- 15253 State Highway 64 E
- 13190 County Road 285
- 13200 County Road 285
- TBD Cr 214
- 10935 Deer Creek Dr
- 10943 Deer Creek Dr
- 10929 Deer Creek Dr
- 10951 Deer Creek Dr
- 10921 Deer Creek Dr
- 10953 Deer Creek Dr
- 10806 County Road 290
- 10928 Deer Creek Dr
- 10936 Deer Creek Dr
- 10920 Deer Creek Dr
- 00000 Deer Creek Dr
- 10961 Deer Creek Dr
- 10913 Deer Creek Dr
- 10944 Deer Creek Dr
- 13650 White Tail Dr
- 10950 Deer Creek Dr
- 10969 Deer Creek Dr
- 13676 White Tail Dr
- 10912 Deer Creek Dr
- 10910 County Road 290