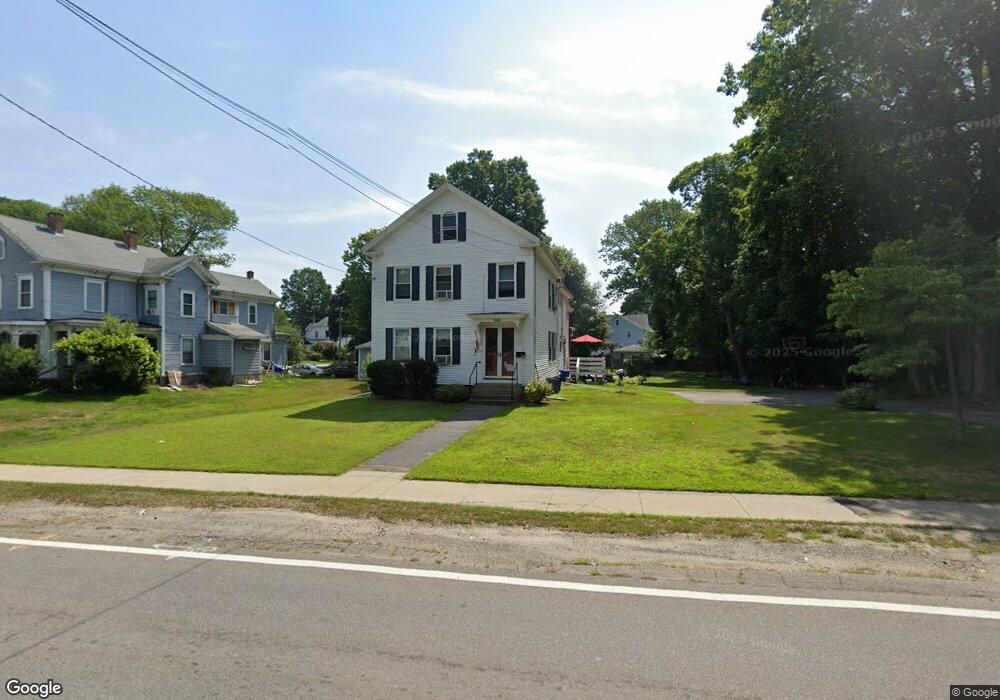
1088 Main St Walpole, MA 02081
Estimated Value: $378,000 - $715,000
5
Beds
2
Baths
2,211
Sq Ft
$271/Sq Ft
Est. Value
About This Home
This home is located at 1088 Main St, Walpole, MA 02081 and is currently estimated at $599,454, approximately $271 per square foot. 1088 Main St is a home located in Norfolk County with nearby schools including Elm Street School, Eleanor N. Johnson Middle School, and Walpole High School.
Ownership History
Date
Name
Owned For
Owner Type
Purchase Details
Closed on
Oct 24, 2025
Sold by
Mary E Campbell Irt and Campbell
Bought by
Campbell Kevin M
Current Estimated Value
Home Financials for this Owner
Home Financials are based on the most recent Mortgage that was taken out on this home.
Original Mortgage
$375,000
Outstanding Balance
$375,000
Interest Rate
6.26%
Mortgage Type
Purchase Money Mortgage
Estimated Equity
$224,454
Purchase Details
Closed on
Mar 11, 2015
Sold by
Campbell Mary E and Campbell John F
Bought by
Mary E Campbell Irt and Campbell
Create a Home Valuation Report for This Property
The Home Valuation Report is an in-depth analysis detailing your home's value as well as a comparison with similar homes in the area
Home Values in the Area
Average Home Value in this Area
Purchase History
| Date | Buyer | Sale Price | Title Company |
|---|---|---|---|
| Campbell Kevin M | $375,000 | -- | |
| Mary E Campbell Irt | -- | -- |
Source: Public Records
Mortgage History
| Date | Status | Borrower | Loan Amount |
|---|---|---|---|
| Open | Campbell Kevin M | $375,000 |
Source: Public Records
Tax History
| Year | Tax Paid | Tax Assessment Tax Assessment Total Assessment is a certain percentage of the fair market value that is determined by local assessors to be the total taxable value of land and additions on the property. | Land | Improvement |
|---|---|---|---|---|
| 2025 | $7,431 | $579,200 | $274,700 | $304,500 |
| 2024 | $7,513 | $568,300 | $264,100 | $304,200 |
| 2023 | $7,498 | $539,800 | $229,700 | $310,100 |
| 2022 | $6,981 | $482,800 | $212,700 | $270,100 |
| 2021 | $6,598 | $444,600 | $200,700 | $243,900 |
| 2020 | $6,158 | $410,800 | $179,300 | $231,500 |
| 2019 | $5,634 | $373,100 | $172,500 | $200,600 |
| 2018 | $5,276 | $345,500 | $156,800 | $188,700 |
| 2017 | $5,148 | $335,800 | $150,800 | $185,000 |
| 2016 | $5,024 | $322,900 | $153,500 | $169,400 |
| 2015 | $4,671 | $297,500 | $129,800 | $167,700 |
| 2014 | $4,455 | $282,700 | $129,800 | $152,900 |
Source: Public Records
Map
Nearby Homes
- 1110 Main St
- 224 School St Unit 9
- 222 School St Unit 9
- 145 South St Unit 5
- 881 Main St Unit 9
- 127 Clear Pond Dr
- 137 Clear Pond Dr
- 260 Elm St
- 1391 Main St Unit 308
- 1391 Main St Unit 306
- 1391 Main St Unit 304
- 2 Kendall St
- 31 Sandtrap Cir Unit 500
- 10 Sandtrap Cir Unit 2
- 13 Sandtrap Cir Unit 14
- 11 Sandtrap Cir Unit 15
- 20 Sandtrap Cir Unit 4
- 19 Sandtrap Cir Unit 11
- 18 Sandtrap Cir Unit 3
- 17 Sandtrap Cir Unit 12
- 1082 Main St
- 1094 Main St Unit 1096
- 1094 Main St Unit A
- 1089 Main St
- 15 Greenwood Rd
- 1085 Main St
- 1106-1108 Main St
- 1108 Main St
- 1106 Main St
- 1083 Main St Unit 1
- 1083 Main St
- 1083 Main St Unit 1083
- 1101 Main St
- 1101 Main St Unit 3
- 1101 Main St Unit 2
- 1081 Main St
- 1068 Main St Unit 2
- 1068 Main St Unit 3
- 1068 Main St
- 47 Lewis Ave Unit 49
Your Personal Tour Guide
Ask me questions while you tour the home.