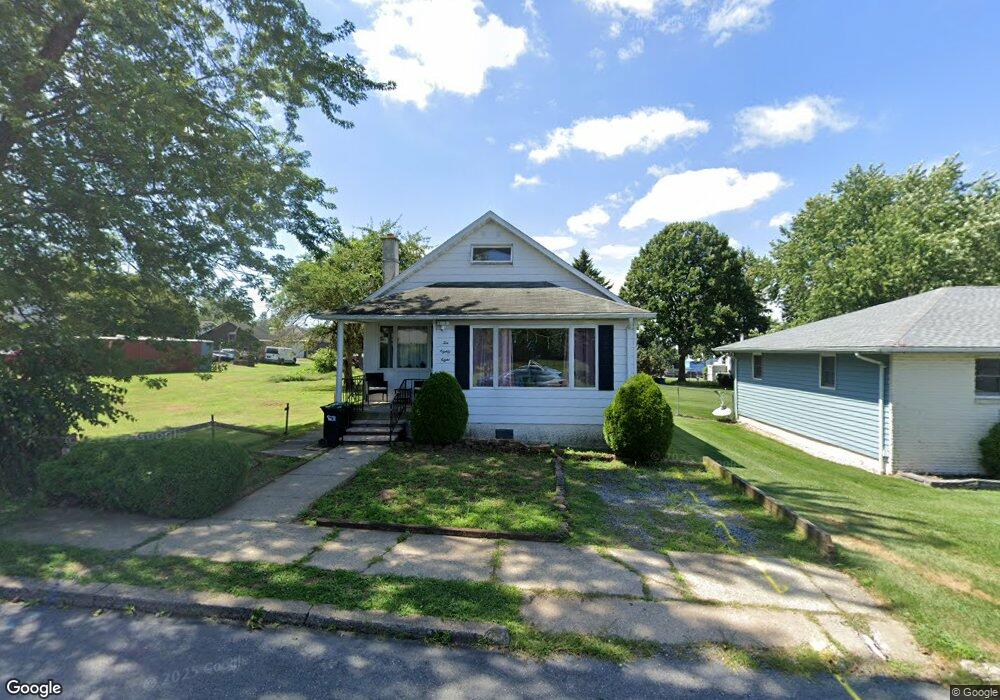
1088 N James St Hazleton, PA 18202
Estimated Value: $222,214 - $257,000
3
Beds
1
Bath
1,168
Sq Ft
$204/Sq Ft
Est. Value
About This Home
This home is located at 1088 N James St, Hazleton, PA 18202 and is currently estimated at $237,804, approximately $203 per square foot. 1088 N James St is a home located in Luzerne County with nearby schools including Hazleton Area High School, Immanuel Christian School, and Bishop Hafey Junior/Senior High School.
Ownership History
Date
Name
Owned For
Owner Type
Purchase Details
Closed on
Jul 18, 2024
Sold by
Suda Mark T and Suda John M
Bought by
Lantigua Francis Marte
Current Estimated Value
Home Financials for this Owner
Home Financials are based on the most recent Mortgage that was taken out on this home.
Original Mortgage
$214,051
Outstanding Balance
$211,435
Interest Rate
6.87%
Mortgage Type
New Conventional
Estimated Equity
$26,369
Purchase Details
Closed on
Nov 17, 2021
Sold by
Suda John M and Suda Bernadine
Bought by
Suda Mark T and Suda John M
Purchase Details
Closed on
Oct 2, 1967
Bought by
Suda John and Suda Bernadine
Create a Home Valuation Report for This Property
The Home Valuation Report is an in-depth analysis detailing your home's value as well as a comparison with similar homes in the area
Home Values in the Area
Average Home Value in this Area
Purchase History
| Date | Buyer | Sale Price | Title Company |
|---|---|---|---|
| Lantigua Francis Marte | $218,000 | None Listed On Document | |
| Suda Mark T | -- | None Available | |
| Suda John | $9,500 | -- |
Source: Public Records
Mortgage History
| Date | Status | Borrower | Loan Amount |
|---|---|---|---|
| Open | Lantigua Francis Marte | $214,051 |
Source: Public Records
Tax History Compared to Growth
Tax History
| Year | Tax Paid | Tax Assessment Tax Assessment Total Assessment is a certain percentage of the fair market value that is determined by local assessors to be the total taxable value of land and additions on the property. | Land | Improvement |
|---|---|---|---|---|
| 2025 | $1,861 | $91,500 | $32,500 | $59,000 |
| 2024 | $1,785 | $91,500 | $32,500 | $59,000 |
| 2023 | $1,750 | $91,500 | $32,500 | $59,000 |
| 2022 | $1,733 | $91,500 | $32,500 | $59,000 |
| 2021 | $1,681 | $91,500 | $32,500 | $59,000 |
| 2020 | $1,650 | $91,500 | $32,500 | $59,000 |
| 2019 | $1,581 | $91,500 | $32,500 | $59,000 |
| 2018 | $1,521 | $91,500 | $32,500 | $59,000 |
| 2017 | $1,488 | $91,500 | $32,500 | $59,000 |
| 2016 | -- | $91,500 | $32,500 | $59,000 |
| 2015 | $954 | $91,500 | $32,500 | $59,000 |
| 2014 | $954 | $91,500 | $32,500 | $59,000 |
Source: Public Records
Map
Nearby Homes
- 1009 Peace St
- 882 N Locust St
- 782 N James St
- 827 N Vine St
- 756 Peace St
- 837 N Laurel St
- 714 Alter St
- 739 N Church St
- 19 W 14th St
- 609 Landmesser Ave
- 991 Seybert St
- 738 N Manhattan Ct
- 60 E Jefferson Ave
- 667 Roosevelt St
- 9 Park St
- 756 Seybert St
- 590 Mckinley St
- 572 N Vine St
- 31 Park St
- 1087 N Rear Locust St