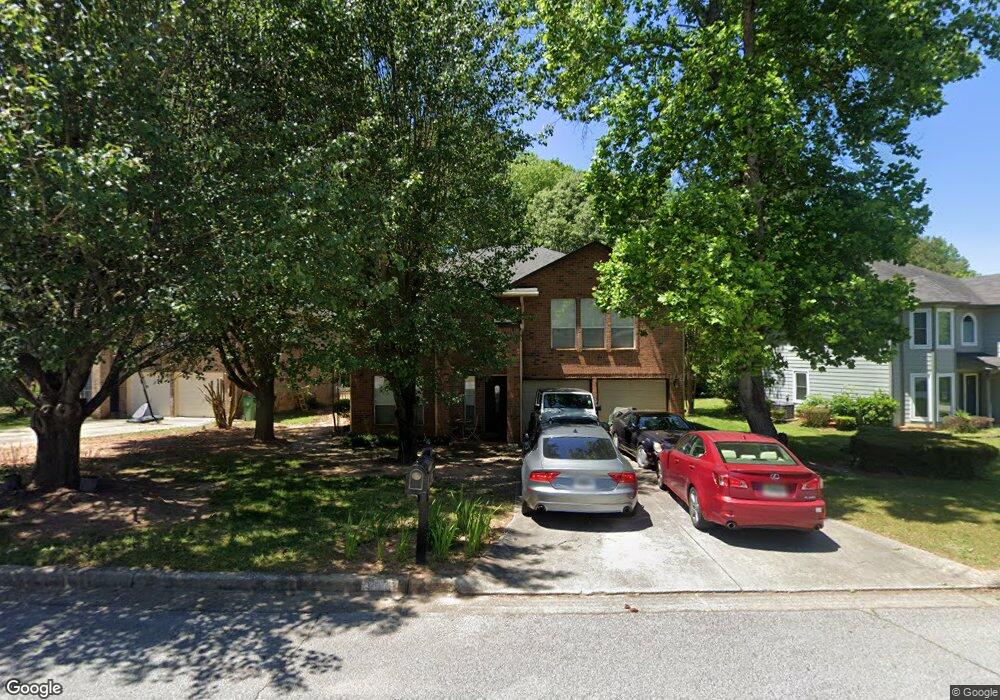
1088 Redan Trace Stone Mountain, GA 30088
Estimated Value: $260,493 - $270,000
4
Beds
3
Baths
2,228
Sq Ft
$119/Sq Ft
Est. Value
About This Home
This home is located at 1088 Redan Trace, Stone Mountain, GA 30088 and is currently estimated at $264,123, approximately $118 per square foot. 1088 Redan Trace is a home located in DeKalb County with nearby schools including Eldridge L. Miller Elementary School, Redan Middle School, and Redan High School.
Ownership History
Date
Name
Owned For
Owner Type
Purchase Details
Closed on
Oct 4, 2002
Sold by
Citifinancial Mtg Co Inc
Bought by
Singleton Joyce
Current Estimated Value
Home Financials for this Owner
Home Financials are based on the most recent Mortgage that was taken out on this home.
Original Mortgage
$134,830
Outstanding Balance
$56,200
Interest Rate
6.21%
Mortgage Type
New Conventional
Estimated Equity
$207,923
Purchase Details
Closed on
May 7, 2002
Sold by
Foster David
Bought by
Citifinancial Mtg Corp
Purchase Details
Closed on
Sep 29, 2000
Sold by
Foster Judy
Bought by
Foster David
Home Financials for this Owner
Home Financials are based on the most recent Mortgage that was taken out on this home.
Original Mortgage
$133,000
Interest Rate
12.19%
Mortgage Type
New Conventional
Purchase Details
Closed on
Dec 9, 1996
Sold by
Chandler George F Karen M
Bought by
Foster Judy
Purchase Details
Closed on
Sep 13, 1996
Sold by
First Indiana Bank
Bought by
Chandler George F Karen
Create a Home Valuation Report for This Property
The Home Valuation Report is an in-depth analysis detailing your home's value as well as a comparison with similar homes in the area
Home Values in the Area
Average Home Value in this Area
Purchase History
| Date | Buyer | Sale Price | Title Company |
|---|---|---|---|
| Singleton Joyce | $139,000 | -- | |
| Citifinancial Mtg Corp | $97,500 | -- | |
| Foster David | $133,000 | -- | |
| Foster Judy | $132,000 | -- | |
| Chandler George F Karen | $95,000 | -- |
Source: Public Records
Mortgage History
| Date | Status | Borrower | Loan Amount |
|---|---|---|---|
| Open | Singleton Joyce | $134,830 | |
| Previous Owner | Foster David | $133,000 | |
| Closed | Chandler George F Karen | $0 |
Source: Public Records
Tax History
| Year | Tax Paid | Tax Assessment Tax Assessment Total Assessment is a certain percentage of the fair market value that is determined by local assessors to be the total taxable value of land and additions on the property. | Land | Improvement |
|---|---|---|---|---|
| 2025 | $3,482 | $107,760 | $12,000 | $95,760 |
| 2024 | $3,582 | $105,320 | $10,000 | $95,320 |
| 2023 | $3,582 | $91,480 | $6,000 | $85,480 |
Source: Public Records
Map
Nearby Homes
- 5349 Signal Ct
- 858 Chapman Cir
- 870 Chapman Cir
- 1144 Redan Trace
- 1050 Chapman Cir Unit 1
- 1142 Chapman Cir
- 5312 Tracey Dr Unit 3
- 1015 Sly Fox Ct
- 5323 Tracey Dr
- 958 Redan Crescent
- 961 Redan Trace
- 1223 Muirfield Dr
- 5452 Forest Path Ct
- 1045 Forest Path
- 1037 Forest Path Unit 3B
- 1183 Muirfield Dr
- 5397 Fox Valley Trace
- 956 Forest Path
- 5472 Forest East Ln
- 5471 Fox Valley Ln Unit 10
- 1096 Redan Trace
- 1080 Redan Trace
- 1102 Redan Trace
- 1074 Redan Trace
- 812 Chapman Cir
- 1110 Redan Trace
- 1087 Redan Trace
- 1068 Redan Trace
- 810 Chapman Cir
- 1081 S Redan
- 816 Chapman Cir
- 1093 Redan Trace
- 1081 Redan Trace Unit 1081
- 1081 Redan Trace
- 1081 Redan Trace Unit 1
- 1116 Redan Trace
- 1077 Redan Trace
- 1062 Redan Trace
- 820 Chapman Cir
- 1105 Redan Trace
Your Personal Tour Guide
Ask me questions while you tour the home.