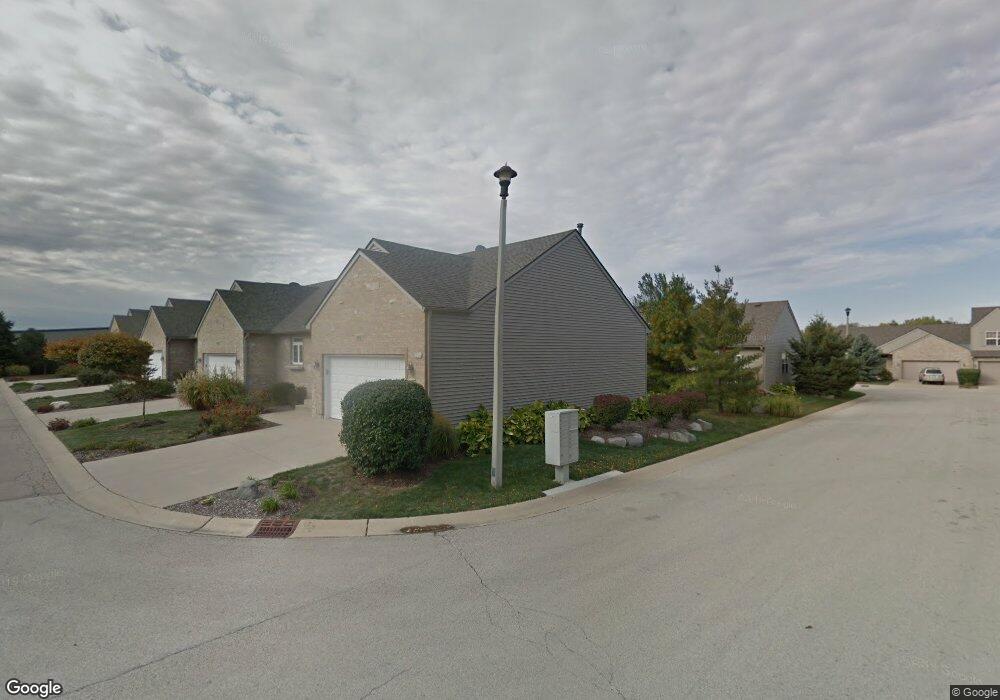
10881 Buck Dr Unit 21 Huntley, IL 60142
Estimated Value: $297,808 - $344,000
Studio
--
Bath
1,218
Sq Ft
$263/Sq Ft
Est. Value
About This Home
This home is located at 10881 Buck Dr Unit 21, Huntley, IL 60142 and is currently estimated at $320,202, approximately $262 per square foot. 10881 Buck Dr Unit 21 is a home located in McHenry County with nearby schools including Martin Elementary School, Chesak Elementary School, and Marlowe Middle School.
Ownership History
Date
Name
Owned For
Owner Type
Purchase Details
Closed on
Aug 6, 2024
Sold by
Ward Martin George
Bought by
Martin G Ward Revocable Trust and Ward
Current Estimated Value
Purchase Details
Closed on
May 20, 2024
Sold by
Ward Martin George and Ward Debra Ann
Bought by
Ward Martin George
Purchase Details
Closed on
May 2, 2018
Sold by
Moretti Patricia F
Bought by
Novalinski David J and Novalinski Julie A
Home Financials for this Owner
Home Financials are based on the most recent Mortgage that was taken out on this home.
Original Mortgage
$200,564
Interest Rate
4.5%
Mortgage Type
VA
Purchase Details
Closed on
Mar 26, 2007
Sold by
Moretti Peter J
Bought by
Moretti Patricia F
Purchase Details
Closed on
Aug 13, 2003
Sold by
Benton & Hankla Group Inc
Bought by
Moretti Peter J and Moretti Patricia F
Create a Home Valuation Report for This Property
The Home Valuation Report is an in-depth analysis detailing your home's value as well as a comparison with similar homes in the area
Home Values in the Area
Average Home Value in this Area
Purchase History
| Date | Buyer | Sale Price | Title Company |
|---|---|---|---|
| Martin G Ward Revocable Trust | -- | None Listed On Document | |
| Ward Martin George | -- | None Listed On Document | |
| Novalinski David J | $208,000 | Attorney | |
| Moretti Patricia F | -- | None Available | |
| Moretti Peter J | $185,000 | Ct |
Source: Public Records
Mortgage History
| Date | Status | Borrower | Loan Amount |
|---|---|---|---|
| Previous Owner | Novalinski David J | $200,564 |
Source: Public Records
Tax History
| Year | Tax Paid | Tax Assessment Tax Assessment Total Assessment is a certain percentage of the fair market value that is determined by local assessors to be the total taxable value of land and additions on the property. | Land | Improvement |
|---|---|---|---|---|
| 2024 | $5,367 | $83,570 | $5,589 | $77,981 |
| 2023 | $5,192 | $75,072 | $5,021 | $70,051 |
| 2022 | $5,450 | $74,111 | $4,572 | $69,539 |
| 2021 | $5,276 | $69,798 | $4,306 | $65,492 |
| 2020 | $5,184 | $67,936 | $4,191 | $63,745 |
| 2019 | $5,058 | $66,202 | $4,084 | $62,118 |
| 2018 | $4,016 | $53,187 | $4,596 | $48,591 |
| 2017 | $3,921 | $50,124 | $4,331 | $45,793 |
| 2016 | $3,945 | $47,656 | $4,118 | $43,538 |
| 2013 | -- | $40,343 | $2,888 | $37,455 |
Source: Public Records
Map
Nearby Homes
- 10826 Timer Dr W Unit 2
- 60.8 Main St
- Lot 2 Ryann Rd
- 0 Ruth Rd Unit MRD12258953
- 2.54 Ruth Rd
- 11611 Main St
- 11618 Douglas Ave
- Lot 3 Ryann Rd
- Lot 1 Ryann Rd
- 10716 N Il Route 47
- 0000 Route 47
- 11008 L J Marak Dr
- 10978 L J Marak Dr
- 10864 Saxony St
- 10813 Chadsey Rd
- 10855 Saxony St
- 10824 Saxony St
- 10782 Chadsey Rd
- 11612 Becky Lee Trace
- 10793 Chadsey Rd
- 10881 Buck Dr Unit 1881
- 10881 Buck Dr Unit 10881
- 10889 Buck Dr Unit 24
- 10885 Buck Dr Unit 23
- 10883 Buck Dr Unit 22
- 10888 Harry Dr Unit 18
- 10882 Harry Dr Unit 19
- 10890 Harry Dr Unit 17
- 11419 Sisters Ct
- 10880 Harry Dr Unit 20
- 11417 Russell Dr Unit 29
- 11417 Russell Dr Unit 1
- 11415 Sisters Ct Unit 26
- 11415 Sisters Ct Unit 11415
- 11415 Sisters Ct Unit O
- 11436 Russell Dr
- 11440 Russell Dr
- 11446 Russell Dr Unit 7
- 11450 Russell Dr
- 11409 Sisters Ct Unit 27
Your Personal Tour Guide
Ask me questions while you tour the home.