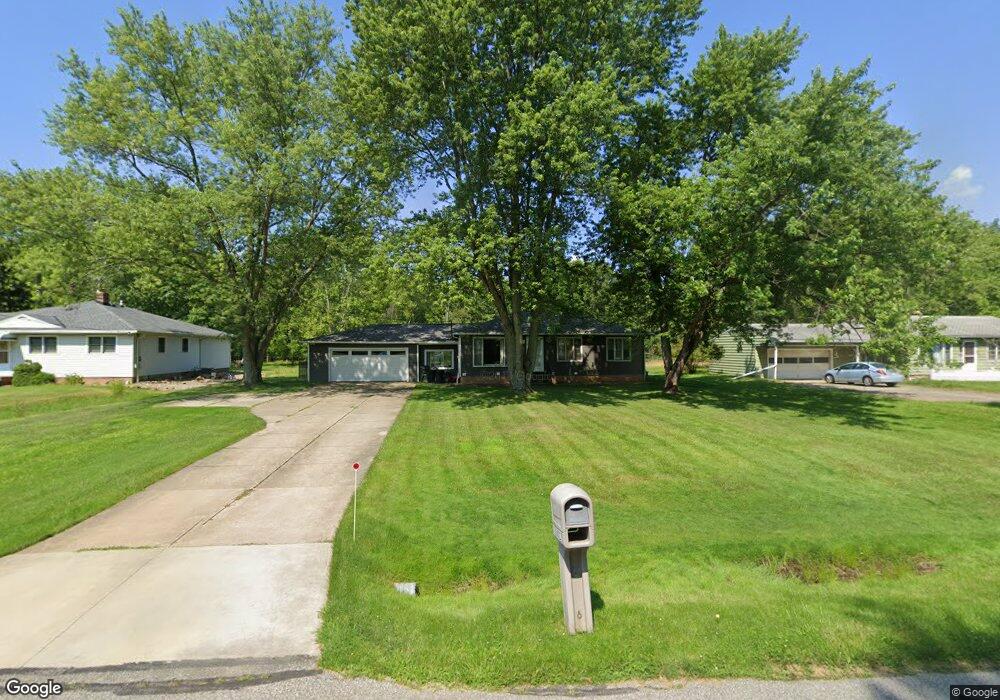
10882 Gregory Ln North Royalton, OH 44133
Estimated Value: $259,221 - $295,000
2
Beds
2
Baths
1,440
Sq Ft
$188/Sq Ft
Est. Value
About This Home
This home is located at 10882 Gregory Ln, North Royalton, OH 44133 and is currently estimated at $270,055, approximately $187 per square foot. 10882 Gregory Ln is a home located in Cuyahoga County with nearby schools including North Royalton Middle School, North Royalton High School, and Royal Redeemer Lutheran School.
Ownership History
Date
Name
Owned For
Owner Type
Purchase Details
Closed on
Dec 18, 2015
Sold by
Mccully Michelle L
Bought by
Bartelme Michael A
Current Estimated Value
Home Financials for this Owner
Home Financials are based on the most recent Mortgage that was taken out on this home.
Original Mortgage
$122,735
Outstanding Balance
$97,062
Interest Rate
3.87%
Mortgage Type
FHA
Estimated Equity
$172,993
Purchase Details
Closed on
Jul 23, 2015
Sold by
Mccully Steven C
Bought by
Mccully Michelle L
Purchase Details
Closed on
Mar 29, 1996
Sold by
Ciresi William S
Bought by
George Christopher A and George Mary K
Home Financials for this Owner
Home Financials are based on the most recent Mortgage that was taken out on this home.
Original Mortgage
$123,250
Interest Rate
6.98%
Mortgage Type
New Conventional
Purchase Details
Closed on
Jan 13, 1976
Sold by
Ciresi Wm S and C M
Bought by
Ciresi William S
Purchase Details
Closed on
Jan 1, 1975
Bought by
Ciresi Wm S and C M
Create a Home Valuation Report for This Property
The Home Valuation Report is an in-depth analysis detailing your home's value as well as a comparison with similar homes in the area
Home Values in the Area
Average Home Value in this Area
Purchase History
| Date | Buyer | Sale Price | Title Company |
|---|---|---|---|
| Bartelme Michael A | $125,000 | Cedar Title Llc | |
| Mccully Michelle L | -- | Attorney | |
| George Christopher A | $145,000 | -- | |
| Ciresi William S | -- | -- | |
| Ciresi Wm S | -- | -- |
Source: Public Records
Mortgage History
| Date | Status | Borrower | Loan Amount |
|---|---|---|---|
| Open | Bartelme Michael A | $122,735 | |
| Previous Owner | George Christopher A | $123,250 |
Source: Public Records
Tax History Compared to Growth
Tax History
| Year | Tax Paid | Tax Assessment Tax Assessment Total Assessment is a certain percentage of the fair market value that is determined by local assessors to be the total taxable value of land and additions on the property. | Land | Improvement |
|---|---|---|---|---|
| 2024 | $3,641 | $62,685 | $18,130 | $44,555 |
| 2023 | $3,744 | $59,120 | $16,000 | $43,120 |
| 2022 | $3,719 | $59,120 | $16,000 | $43,120 |
| 2021 | $3,758 | $59,120 | $16,000 | $43,120 |
| 2020 | $3,497 | $52,290 | $14,140 | $38,150 |
| 2019 | $3,395 | $149,400 | $40,400 | $109,000 |
| 2018 | $3,431 | $52,290 | $14,140 | $38,150 |
| 2017 | $3,270 | $47,600 | $13,300 | $34,300 |
| 2016 | $3,065 | $47,600 | $13,300 | $34,300 |
| 2015 | $3,441 | $53,030 | $13,300 | $39,730 |
| 2014 | $3,441 | $53,030 | $13,300 | $39,730 |
Source: Public Records
Map
Nearby Homes
- 10821 Gregory Ln
- 9901 Beechwood Dr
- 9841 Beechwood Dr
- 10641 Albion Rd
- 8981 Edgewood Dr
- 8960 Wildwood Dr
- 9912 Lynn Dr
- 8963 Abbey Rd
- 9938 Abbey Rd
- 12658 Gardenside Dr
- 12721 Patricia Dr
- 10700 Abbey Rd
- 8414 York Rd
- 9581 Tilby Rd
- 11432 Harbour Light Dr Unit 1
- 12631 Pinebrook Dr
- 11000 W Sprague Rd
- 9800 Cove Dr Unit H2
- 9821 Sunrise Blvd Unit o1
- 11445 Harbour Light Dr
- 10870 Gregory Ln
- 10894 Gregory Ln
- 10858 Gregory Ln
- 10906 Gregory Ln
- 10881 Gregory Ln
- 10893 Gregory Ln
- 10846 Gregory Ln
- 10918 Gregory Ln
- 10869 Gregory Ln
- 10857 Gregory Ln
- 10905 Gregory Ln
- 10834 Gregory Ln
- 10930 Gregory Ln
- 10917 Gregory Ln
- 10845 Gregory Ln
- 10929 Gregory Ln
- 10822 Gregory Ln
- 10833 Gregory Ln
- 10193 Delsy Dr
- 10942 Gregory Ln