Estimated Value: $164,000 - $254,538
3
Beds
2
Baths
1,568
Sq Ft
$141/Sq Ft
Est. Value
About This Home
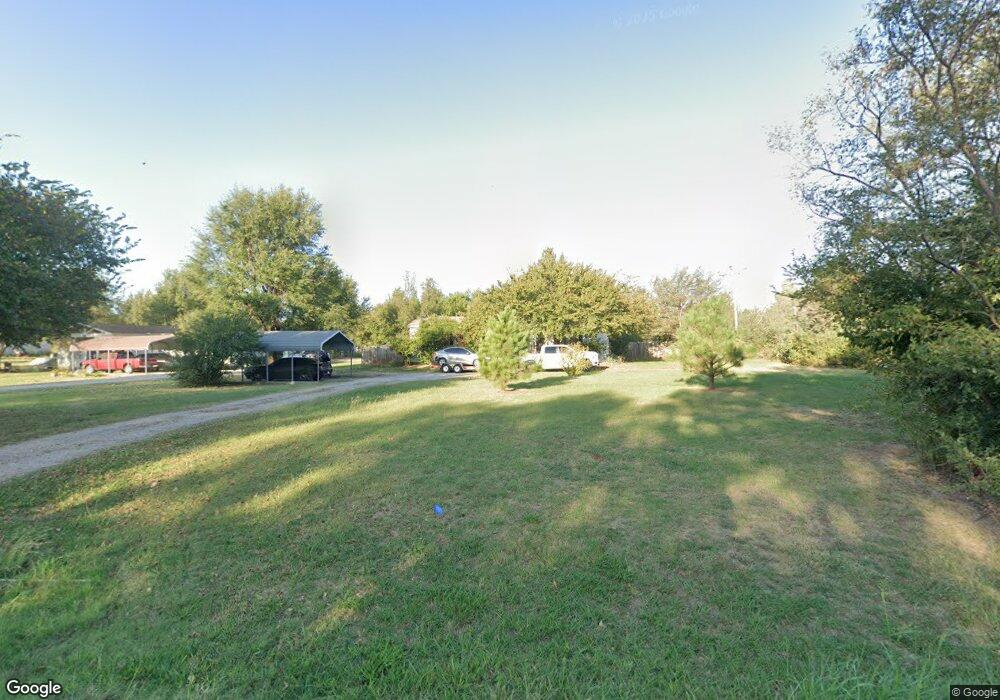
This home is located at 10885 N Richland Rd, Yukon, OK 73099 and is currently estimated at $220,635, approximately $140 per square foot. 10885 N Richland Rd is a home located in Canadian County with nearby schools including Central Elementary School, Redstone Intermediate School, and Yukon Middle School.
Ownership History
Date
Name
Owned For
Owner Type
Purchase Details
Closed on
Jan 3, 2013
Sold by
Doyle Dennis L
Bought by
Doyle Dennis L and Webb Brandy
Current Estimated Value
Purchase Details
Closed on
Sep 17, 2010
Sold by
Ingram Karen S
Bought by
Doyle Dennis L
Home Financials for this Owner
Home Financials are based on the most recent Mortgage that was taken out on this home.
Original Mortgage
$79,429
Outstanding Balance
$52,636
Interest Rate
4.51%
Mortgage Type
FHA
Estimated Equity
$167,999
Purchase Details
Closed on
Aug 27, 2010
Sold by
Ingram James K
Bought by
Ingram Karen S
Home Financials for this Owner
Home Financials are based on the most recent Mortgage that was taken out on this home.
Original Mortgage
$79,429
Outstanding Balance
$52,636
Interest Rate
4.51%
Mortgage Type
FHA
Estimated Equity
$167,999
Purchase Details
Closed on
Aug 20, 2009
Sold by
Ingram James K
Bought by
Ingram Karen S
Purchase Details
Closed on
Aug 26, 2002
Sold by
Smith Quentin R
Home Financials for this Owner
Home Financials are based on the most recent Mortgage that was taken out on this home.
Original Mortgage
$70,000
Interest Rate
6.33%
Create a Home Valuation Report for This Property
The Home Valuation Report is an in-depth analysis detailing your home's value as well as a comparison with similar homes in the area
Home Values in the Area
Average Home Value in this Area
Purchase History
| Date | Buyer | Sale Price | Title Company |
|---|---|---|---|
| Doyle Dennis L | -- | None Available | |
| Doyle Dennis L | $80,500 | Ort | |
| Ingram Karen S | -- | Ort | |
| Ingram Karen S | -- | None Available | |
| -- | $15,000 | -- |
Source: Public Records
Mortgage History
| Date | Status | Borrower | Loan Amount |
|---|---|---|---|
| Open | Doyle Dennis L | $79,429 | |
| Previous Owner | -- | $70,000 |
Source: Public Records
Tax History Compared to Growth
Tax History
| Year | Tax Paid | Tax Assessment Tax Assessment Total Assessment is a certain percentage of the fair market value that is determined by local assessors to be the total taxable value of land and additions on the property. | Land | Improvement |
|---|---|---|---|---|
| 2024 | $1,428 | $13,309 | $1,152 | $12,157 |
| 2023 | $1,428 | $12,675 | $1,152 | $11,523 |
| 2022 | $1,360 | $12,071 | $1,152 | $10,919 |
| 2021 | $1,296 | $11,496 | $1,152 | $10,344 |
| 2020 | $1,217 | $10,949 | $1,800 | $9,149 |
| 2019 | $1,159 | $10,428 | $1,800 | $8,628 |
| 2018 | $1,105 | $9,931 | $1,800 | $8,131 |
| 2017 | $1,049 | $9,458 | $1,800 | $7,658 |
| 2016 | $1,001 | $9,458 | $1,800 | $7,658 |
| 2015 | -- | $8,579 | $1,800 | $6,779 |
| 2014 | -- | $8,171 | $1,800 | $6,371 |
Source: Public Records
Map
Nearby Homes
- 14875 Arrowhead Dr
- 10715 N 6th St
- 15170 Arrowhead Dr
- 14900 W Britton Rd
- 12680 Schein Rd
- 9300 NW 128th St
- 9304 NW 128th St
- 9308 NW 128th St
- 9313 NW 128th St
- 9301 NW 128th St
- 9309 NW 128th St
- 13600 W Britton Rd
- 8280 Prairie Ridge Rd
- 9316 NW 118th St
- 1004 Acacia Creek Dr
- 12316 SW 31st St
- 11625 Jude Way
- 11608 Jude Way
- 9304 NW 89th St
- 9133 NW 115th St
- 8080 N Banner Rd
- 9600 High Noon Rd
- 14788 W Hefner Rd
- 14788 W Hefner Rd
- 14655 Funston
- 10813 Blue Creek Dr
- 10805 Blue Creek Dr
- 10801 Blue Creek Dr
- 10625 N Richland Rd
- 10625 N Richland Rd
- 10625 N Richland Rd
- 14824 W Hefner Rd
- 14765 Funston
- 14680 Funston
- 14720 Funston
- 10900 N Richland Rd
- 14760 W Funston
- 14665 W Broadway St
- 14725 W Broadway St
- 14820 W Funston