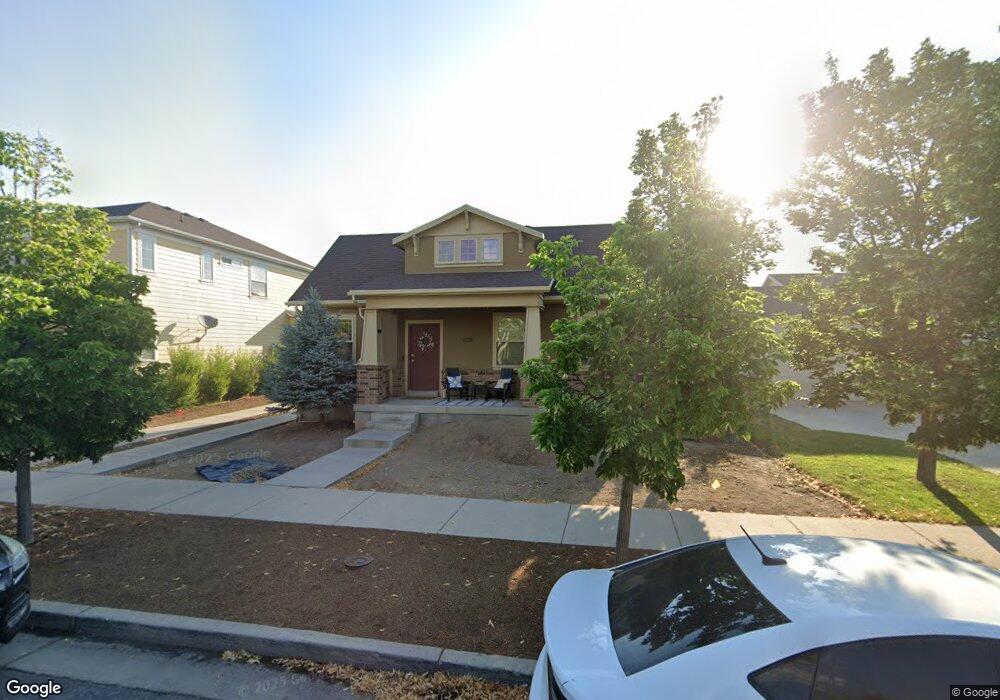
10889 S Weiss Dr South Jordan, UT 84009
Daybreak NeighborhoodEstimated Value: $640,000 - $718,565
5
Beds
3
Baths
1,689
Sq Ft
$402/Sq Ft
Est. Value
About This Home
This home is located at 10889 S Weiss Dr, South Jordan, UT 84009 and is currently estimated at $678,891, approximately $401 per square foot. 10889 S Weiss Dr is a home located in Salt Lake County with nearby schools including Eastlake Elementary School, Mountain Creek Middle School, and Herriman High School.
Ownership History
Date
Name
Owned For
Owner Type
Purchase Details
Closed on
Dec 17, 2015
Sold by
Kantz John M
Bought by
Widerburg Jeffrey Brian and Widerburg Patricia Fernandes
Current Estimated Value
Home Financials for this Owner
Home Financials are based on the most recent Mortgage that was taken out on this home.
Original Mortgage
$357,525
Outstanding Balance
$282,363
Interest Rate
3.83%
Mortgage Type
VA
Estimated Equity
$396,528
Purchase Details
Closed on
Mar 6, 2012
Sold by
Kantz John M
Bought by
Kantz John M
Purchase Details
Closed on
Dec 22, 2009
Sold by
Richmond American Homes Of Utah Inc
Bought by
Kantz John M
Home Financials for this Owner
Home Financials are based on the most recent Mortgage that was taken out on this home.
Original Mortgage
$295,137
Interest Rate
4.88%
Mortgage Type
FHA
Purchase Details
Closed on
Nov 15, 2006
Sold by
Kennecott Land Residential Development C
Bought by
Richmond American Homes Of Utah Inc
Create a Home Valuation Report for This Property
The Home Valuation Report is an in-depth analysis detailing your home's value as well as a comparison with similar homes in the area
Home Values in the Area
Average Home Value in this Area
Purchase History
| Date | Buyer | Sale Price | Title Company |
|---|---|---|---|
| Widerburg Jeffrey Brian | -- | Meridian Title | |
| Kantz John M | -- | None Available | |
| Kantz John M | -- | First American Title | |
| Richmond American Homes Of Utah Inc | -- | Talon Group |
Source: Public Records
Mortgage History
| Date | Status | Borrower | Loan Amount |
|---|---|---|---|
| Open | Widerburg Jeffrey Brian | $357,525 | |
| Previous Owner | Kantz John M | $295,137 |
Source: Public Records
Tax History Compared to Growth
Tax History
| Year | Tax Paid | Tax Assessment Tax Assessment Total Assessment is a certain percentage of the fair market value that is determined by local assessors to be the total taxable value of land and additions on the property. | Land | Improvement |
|---|---|---|---|---|
| 2025 | -- | $621,200 | $105,000 | $516,200 |
| 2024 | -- | $614,000 | $102,000 | $512,000 |
| 2023 | $3,466 | $601,400 | $99,000 | $502,400 |
| 2022 | $3,466 | $608,500 | $97,100 | $511,400 |
| 2021 | $2,920 | $437,800 | $74,800 | $363,000 |
| 2020 | $2,994 | $400,100 | $70,500 | $329,600 |
| 2019 | $2,697 | $392,000 | $70,500 | $321,500 |
| 2018 | $2,744 | $371,300 | $69,400 | $301,900 |
| 2017 | $2,774 | $351,200 | $69,400 | $281,800 |
| 2016 | $2,554 | $329,300 | $69,400 | $259,900 |
| 2015 | $2,389 | $318,600 | $84,000 | $234,600 |
| 2014 | $2,300 | $301,400 | $99,100 | $202,300 |
Source: Public Records
Map
Nearby Homes
- 10984 Manitou Way
- 10819 S Indigo Sky Way
- 4251 W Lake Bridge Dr
- 4257 Lake Bridge Dr
- 10711 S Navarro Way
- 11054 S Lake Run Rd
- 10896 S Poplar Brook Place
- 11061 S Indigo Sky Way
- 11078 Topview Rd
- 10934 Coralville Way
- 4218 W Open Crest Dr
- 3884 Sand Lake Dr
- 3856 W Coastal Dune Dr
- 10674 S Pine Shadow Rd
- 10674 Pine Shadow Rd
- 10918 Little Sahara Dr Unit 1001
- 10941 Little Sahara Dr
- 11789 4000 W
- 4507 W Talquin Ln
- 10984 S Nellis Dune Ct
- 10889 S Weiss Dr
- 10881 S Weiss Dr
- 10881 S Weiss Dr
- 10897 Weiss Dr
- 10874 S Navarro Way
- 10874 Navarro Way
- 10873 S Weiss Dr
- 10866 Navarro Way
- 10882 Navarro Way
- 10866 S Navarro Way
- 10882 S Navarro Way
- 10907 Weiss Dr
- 10894 Weiss Dr
- 10894 S Weiss Dr
- 10899 Tahoe Way
- 10899 S Tahoe Way
- 10856 Navarro Way
- 10888 Navarro Way
- 10888 S Navarro Way
- 10896 Weiss Dr