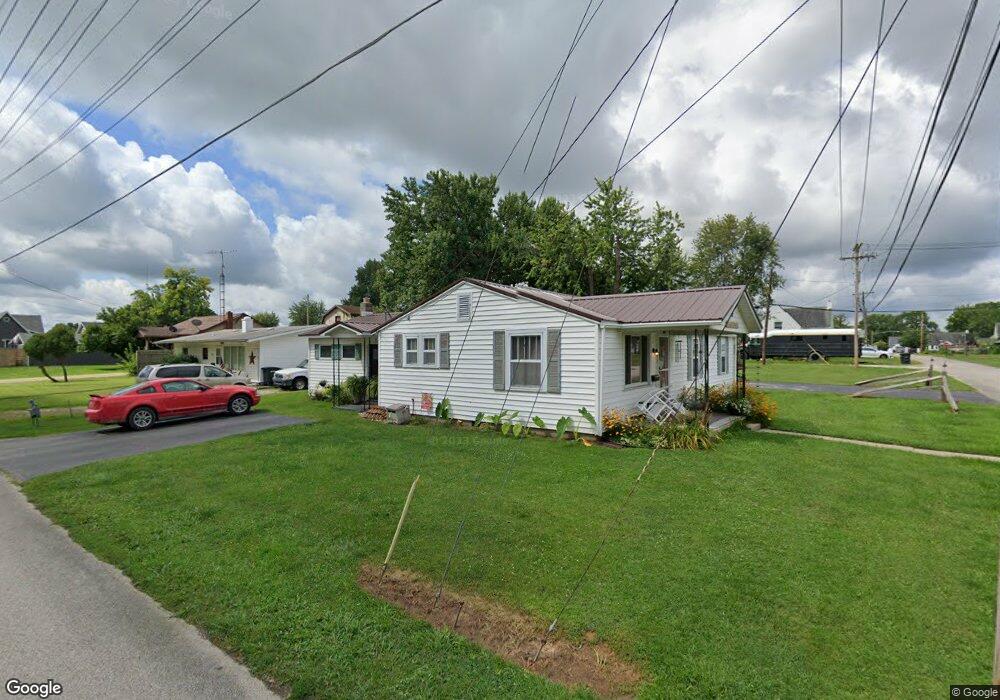
1089 D St NE Linton, IN 47441
Estimated Value: $115,000 - $136,000
Studio
1
Bath
1,336
Sq Ft
$95/Sq Ft
Est. Value
About This Home
This home is located at 1089 D St NE, Linton, IN 47441 and is currently estimated at $126,943, approximately $95 per square foot. 1089 D St NE is a home located in Greene County with nearby schools including Linton-Stockton Elementary School, Linton-Stockton Junior High School, and Linton-Stockton High School.
Ownership History
Date
Name
Owned For
Owner Type
Purchase Details
Closed on
Dec 3, 2021
Sold by
Morris Richard D and Gilley Alisha Kay
Bought by
Morris Richard D and Gilley Alisha Kay
Current Estimated Value
Home Financials for this Owner
Home Financials are based on the most recent Mortgage that was taken out on this home.
Original Mortgage
$50,000
Outstanding Balance
$45,532
Interest Rate
3.14%
Mortgage Type
New Conventional
Estimated Equity
$81,411
Purchase Details
Closed on
Jul 14, 2014
Sold by
Bemis Dorothy M
Bought by
Morris Richard D and Morris Alisha
Purchase Details
Closed on
Jan 11, 2012
Sold by
Bemis John D and Bemis Dorothy M
Bought by
Bemis Dorothy M
Create a Home Valuation Report for This Property
The Home Valuation Report is an in-depth analysis detailing your home's value as well as a comparison with similar homes in the area
Home Values in the Area
Average Home Value in this Area
Purchase History
| Date | Buyer | Sale Price | Title Company |
|---|---|---|---|
| Morris Richard D | -- | None Available | |
| Morris Richard D | -- | -- | |
| Bemis Dorothy M | -- | None Available |
Source: Public Records
Mortgage History
| Date | Status | Borrower | Loan Amount |
|---|---|---|---|
| Open | Morris Richard D | $50,000 |
Source: Public Records
Tax History
| Year | Tax Paid | Tax Assessment Tax Assessment Total Assessment is a certain percentage of the fair market value that is determined by local assessors to be the total taxable value of land and additions on the property. | Land | Improvement |
|---|---|---|---|---|
| 2024 | $447 | $43,500 | $6,700 | $36,800 |
| 2023 | $429 | $43,100 | $6,700 | $36,400 |
| 2022 | $336 | $44,500 | $6,700 | $37,800 |
| 2021 | $326 | $40,900 | $6,700 | $34,200 |
| 2020 | $418 | $40,900 | $6,700 | $34,200 |
| 2019 | $421 | $40,900 | $6,700 | $34,200 |
| 2018 | $421 | $40,900 | $6,700 | $34,200 |
| 2017 | $415 | $40,900 | $6,700 | $34,200 |
| 2016 | $374 | $38,900 | $6,700 | $32,200 |
| 2014 | $12 | $43,700 | $6,700 | $37,000 |
| 2013 | -- | $43,300 | $6,700 | $36,600 |
Source: Public Records
Map
Nearby Homes
Your Personal Tour Guide
Ask me questions while you tour the home.