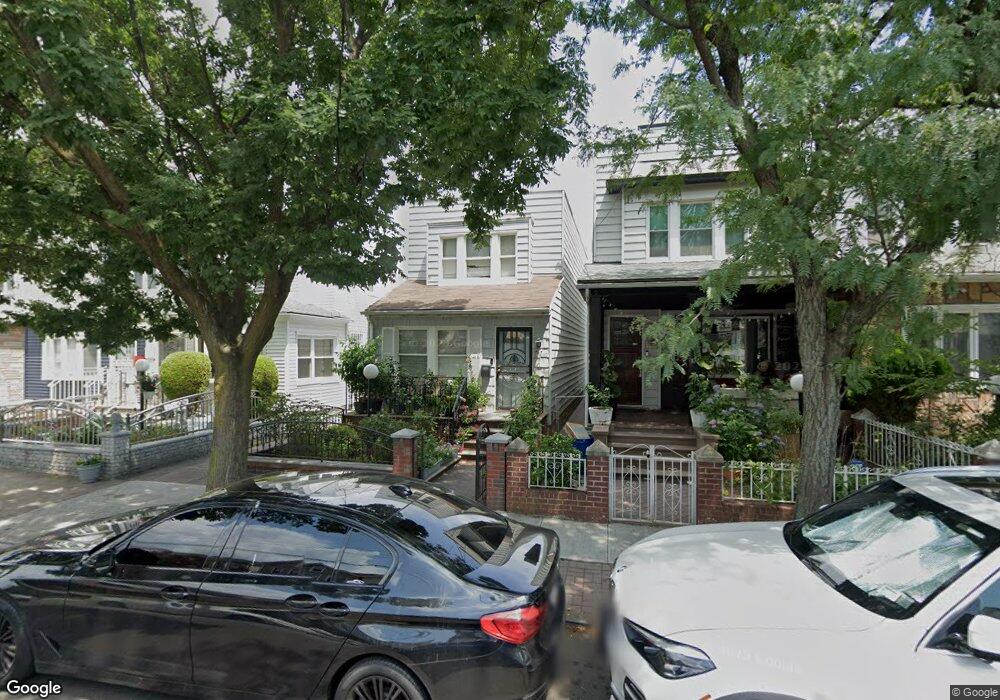
1089 E 37th St Brooklyn, NY 11210
Flatlands NeighborhoodEstimated Value: $688,201 - $823,000
4
Beds
2
Baths
1,374
Sq Ft
$555/Sq Ft
Est. Value
About This Home
This home is located at 1089 E 37th St, Brooklyn, NY 11210 and is currently estimated at $762,300, approximately $554 per square foot. 1089 E 37th St is a home located in Kings County with nearby schools including P.S. 109, Andries Hudde School, and Christian Heritage Academy.
Ownership History
Date
Name
Owned For
Owner Type
Purchase Details
Closed on
Nov 30, 2007
Sold by
Uddin Syed
Bought by
Ahamed Tiasha and Nabab Ahamed
Current Estimated Value
Purchase Details
Closed on
May 4, 2005
Sold by
Hamlet Joanne P
Bought by
Uddin Syed
Home Financials for this Owner
Home Financials are based on the most recent Mortgage that was taken out on this home.
Original Mortgage
$39,950
Interest Rate
5.95%
Purchase Details
Closed on
Jan 16, 2001
Sold by
Rouse Stephanie A
Bought by
Hamlet Joanne
Home Financials for this Owner
Home Financials are based on the most recent Mortgage that was taken out on this home.
Original Mortgage
$228,000
Interest Rate
6.89%
Purchase Details
Closed on
Mar 25, 1999
Sold by
Hamlet Ruthven
Bought by
Rouse Stephanie A
Home Financials for this Owner
Home Financials are based on the most recent Mortgage that was taken out on this home.
Original Mortgage
$188,700
Interest Rate
7.85%
Create a Home Valuation Report for This Property
The Home Valuation Report is an in-depth analysis detailing your home's value as well as a comparison with similar homes in the area
Home Values in the Area
Average Home Value in this Area
Purchase History
| Date | Buyer | Sale Price | Title Company |
|---|---|---|---|
| Ahamed Tiasha | $430,000 | -- | |
| Ahamed Tiasha | $430,000 | -- | |
| Uddin Syed | $340,000 | -- | |
| Uddin Syed | $340,000 | -- | |
| Hamlet Joanne | -- | -- | |
| Hamlet Joanne | -- | -- | |
| Rouse Stephanie A | -- | -- | |
| Rouse Stephanie A | -- | -- |
Source: Public Records
Mortgage History
| Date | Status | Borrower | Loan Amount |
|---|---|---|---|
| Previous Owner | Uddin Syed | $39,950 | |
| Previous Owner | Uddin Syed | $266,000 | |
| Previous Owner | Hamlet Joanne | $228,000 | |
| Previous Owner | Rouse Stephanie A | $188,700 |
Source: Public Records
Tax History
| Year | Tax Paid | Tax Assessment Tax Assessment Total Assessment is a certain percentage of the fair market value that is determined by local assessors to be the total taxable value of land and additions on the property. | Land | Improvement |
|---|---|---|---|---|
| 2025 | $6,093 | $40,920 | $8,100 | $32,820 |
| 2024 | $6,093 | $48,120 | $8,100 | $40,020 |
| 2023 | $5,813 | $49,620 | $8,100 | $41,520 |
| 2022 | $5,643 | $40,620 | $8,100 | $32,520 |
| 2021 | $5,881 | $42,000 | $8,100 | $33,900 |
| 2020 | $2,803 | $35,040 | $8,100 | $26,940 |
| 2019 | $5,289 | $35,040 | $8,100 | $26,940 |
| 2018 | $4,862 | $23,851 | $6,466 | $17,385 |
| 2017 | $4,801 | $23,554 | $6,223 | $17,331 |
| 2016 | $4,655 | $23,288 | $7,705 | $15,583 |
| 2015 | $2,680 | $22,332 | $8,438 | $13,894 |
| 2014 | $2,680 | $21,068 | $8,251 | $12,817 |
Source: Public Records
Map
Nearby Homes
- 1065 E 39th St
- 3523 Avenue I
- 3517 Avenue I
- 1144 E 37th St
- 3708 Avenue H
- 1810 Avenue N Unit 4C
- 1810 Avenue N Unit 2F
- 1681 Brooklyn Ave
- 3510 Avenue H Unit 3 H
- 4109 Avenue I
- 927 E 35th St
- 1655 Flatbush Ave Unit B711
- 1655 Flatbush Ave Unit B1809
- 1655 Flatbush Ave Unit A602
- 1655 Flatbush Ave Unit B1802
- 1655 Flatbush Ave Unit C202
- 1655 Flatbush Ave Unit A903
- 1655 Flatbush Ave Unit A1401
- 3320 Avenue H Unit 6P
- 1708 Flatbush Ave
- 1091 E 37th St
- 1087 E 37th St
- 1093 E 37th St
- 1085 E 37th St
- 1083 E 37th St
- 1081 E 37th St
- 1079 E 37th St
- 1022 E 38th St
- 3705 Avenue I
- 3703 Avenue I
- 1020 E 38th St
- 1026 E 38th St
- 3709 Avenue I
- 1018 E 38th St
- 3701 Avenue I
- 1016 E 38th St
- 1071 E 37th St
- 1012 E 38th St
- 1012 E 38th St Unit Building
- 3715 Avenue I
Your Personal Tour Guide
Ask me questions while you tour the home.