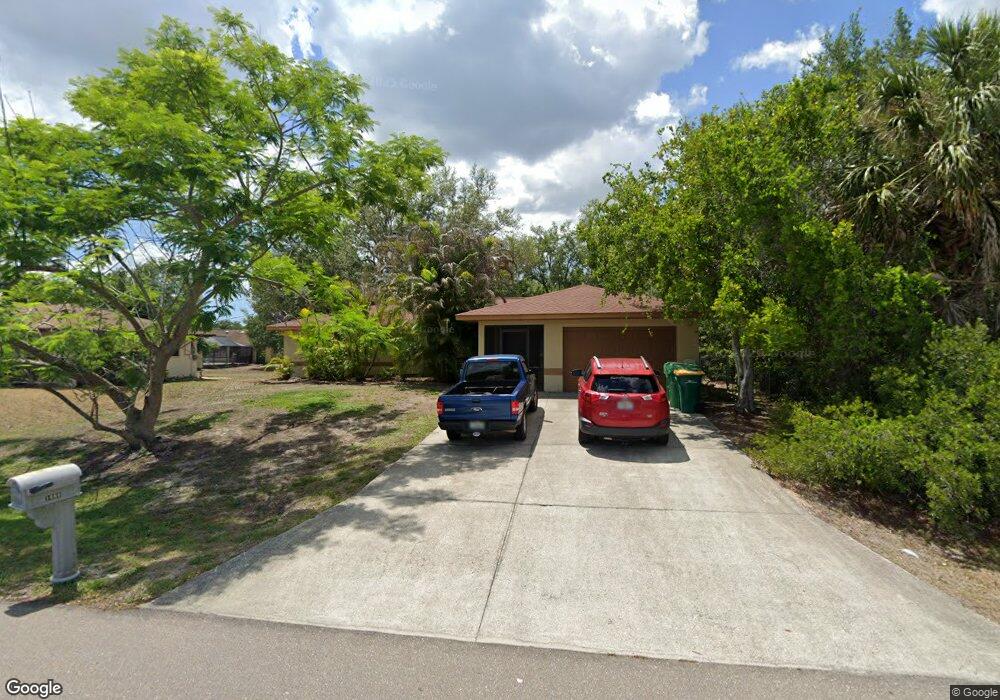
1089 Marlene St Port Charlotte, FL 33952
Estimated Value: $280,885 - $357,000
3
Beds
3
Baths
2,734
Sq Ft
$116/Sq Ft
Est. Value
About This Home
This home is located at 1089 Marlene St, Port Charlotte, FL 33952 and is currently estimated at $318,471, approximately $116 per square foot. 1089 Marlene St is a home located in Charlotte County with nearby schools including Neil Armstrong Elementary School, Port Charlotte Middle School, and Port Charlotte High School.
Ownership History
Date
Name
Owned For
Owner Type
Purchase Details
Closed on
May 31, 2018
Sold by
Howell Leslie Marie and Facilitation Realty Land Trust
Bought by
Cozics Llc
Current Estimated Value
Purchase Details
Closed on
Sep 30, 2014
Sold by
Eldridge Francis L and Eldridge Family Trust
Bought by
Fenard Properties Llc
Purchase Details
Closed on
Feb 26, 2010
Sold by
Howell Leslie Marie and Facilitation Realty Land Trust
Bought by
Eldridge Francis L and Eldridge Family Trust
Purchase Details
Closed on
Oct 19, 2009
Sold by
Mayo Maribeth C
Bought by
Howell Leslie Marie and Facilitation Realty Land Trust
Purchase Details
Closed on
Jan 21, 1997
Sold by
Monperoux Marie A
Bought by
Mayo Bernard G and Mayo Maribeth
Home Financials for this Owner
Home Financials are based on the most recent Mortgage that was taken out on this home.
Original Mortgage
$62,250
Interest Rate
7.56%
Create a Home Valuation Report for This Property
The Home Valuation Report is an in-depth analysis detailing your home's value as well as a comparison with similar homes in the area
Home Values in the Area
Average Home Value in this Area
Purchase History
| Date | Buyer | Sale Price | Title Company |
|---|---|---|---|
| Cozics Llc | $200,000 | Attorney | |
| Fenard Properties Llc | $100,000 | Florida Abstract & Security | |
| Eldridge Francis L | -- | None Available | |
| Howell Leslie Marie | $300,000 | Attorney | |
| Mayo Bernard G | $83,000 | -- |
Source: Public Records
Mortgage History
| Date | Status | Borrower | Loan Amount |
|---|---|---|---|
| Previous Owner | Mayo Bernard G | $62,250 |
Source: Public Records
Tax History Compared to Growth
Tax History
| Year | Tax Paid | Tax Assessment Tax Assessment Total Assessment is a certain percentage of the fair market value that is determined by local assessors to be the total taxable value of land and additions on the property. | Land | Improvement |
|---|---|---|---|---|
| 2023 | $4,620 | $208,902 | $0 | $0 |
| 2022 | $4,145 | $257,316 | $14,025 | $243,291 |
| 2021 | $3,531 | $172,646 | $5,950 | $166,696 |
| 2020 | $3,420 | $166,706 | $5,100 | $161,606 |
| 2019 | $3,396 | $166,991 | $4,675 | $162,316 |
| 2018 | $3,118 | $169,080 | $4,250 | $164,830 |
| 2017 | $2,886 | $149,052 | $3,808 | $145,244 |
| 2016 | $2,709 | $128,591 | $0 | $0 |
| 2015 | $2,480 | $116,901 | $0 | $0 |
| 2014 | $2,419 | $110,884 | $0 | $0 |
Source: Public Records
Map
Nearby Homes
- 22412 Cezane Ave
- 22452 Delhi Ave
- 1091 Cazenovia St
- 22484 Bradford Ave
- 22342 Bradford Ave
- 22394 Peachland Blvd
- 376 Macarthur Dr
- 1218 Marlow St
- 22483 Cezane Ave
- 1141 Cazenovia St
- 22442 Peachland Blvd
- 22491 Delhi Ave
- 1203 Desmond St
- 1234 Tift St
- 1065 Marcus St
- 1097 Orlando Blvd
- 1049 Marcus St
- 1170 Rizzo St
- 1160 Rizzo St
- 22270 Esplanade Ave
- 1097 Marlene St
- 1073 Marlene St
- 1105 Marlene St
- 1104 Street
- 22378 Delhi Ave
- 1104 Staley St
- 22377 Delhi Ave
- 1117 Marlene St
- 22387 Delhi Ave
- 1064 Staley St
- 1116 Staley St
- 22378 Hallstead Ave
- 1097 Staley St
- 22396 Delhi Ave
- 1105 Staley St
- 22365 Hallstead Ave
- 1056 Staley St
- 22395 Delhi Ave
- 1057 Marlene St
- 1065 Staley St