Estimated Value: $230,000 - $374,000
4
Beds
2
Baths
2,258
Sq Ft
$128/Sq Ft
Est. Value
About This Home
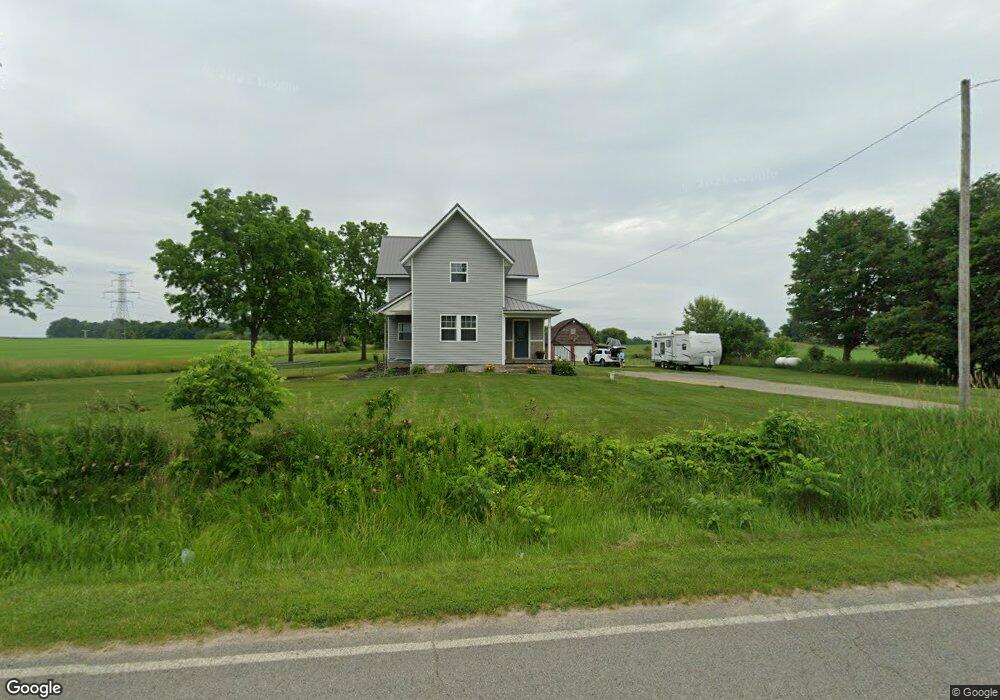
This home is located at 1089 W 128th St, Grant, MI 49327 and is currently estimated at $288,648, approximately $127 per square foot. 1089 W 128th St is a home located in Newaygo County with nearby schools including Grant Elementary School, Grant Primary Center, and Grant Middle School.
Ownership History
Date
Name
Owned For
Owner Type
Purchase Details
Closed on
Jun 5, 2009
Sold by
Ez Cor Llc
Bought by
Stalter Derrik and Stalter Jamie
Current Estimated Value
Purchase Details
Closed on
Jan 13, 2009
Sold by
Wells Fargo Bank
Bought by
Ez Cor Llc
Purchase Details
Closed on
Mar 4, 2008
Sold by
Phillips Ricky L
Bought by
Wells Fargo Bank
Purchase Details
Closed on
Oct 20, 2006
Sold by
Allerding Chad
Bought by
Phillips Rick L
Purchase Details
Closed on
Mar 10, 2005
Sold by
Miller Lori J
Bought by
Allerding Chad
Purchase Details
Closed on
Feb 27, 2004
Sold by
Roberts Paul D and Roberts Donna L
Bought by
Miller Mitchell and Miller Lori J
Home Financials for this Owner
Home Financials are based on the most recent Mortgage that was taken out on this home.
Original Mortgage
$108,300
Interest Rate
5.71%
Mortgage Type
Purchase Money Mortgage
Create a Home Valuation Report for This Property
The Home Valuation Report is an in-depth analysis detailing your home's value as well as a comparison with similar homes in the area
Home Values in the Area
Average Home Value in this Area
Purchase History
| Date | Buyer | Sale Price | Title Company |
|---|---|---|---|
| Stalter Derrik | $91,500 | -- | |
| Ez Cor Llc | $47,500 | Attorney'S Title | |
| Wells Fargo Bank | $91,000 | -- | |
| Phillips Rick L | $141,500 | -- | |
| Allerding Chad | $124,000 | -- | |
| Miller Mitchell | $114,000 | Metropolitan Title Company | |
| Miller Lori J | $114,000 | -- |
Source: Public Records
Mortgage History
| Date | Status | Borrower | Loan Amount |
|---|---|---|---|
| Previous Owner | Miller Lori J | $108,300 |
Source: Public Records
Tax History Compared to Growth
Tax History
| Year | Tax Paid | Tax Assessment Tax Assessment Total Assessment is a certain percentage of the fair market value that is determined by local assessors to be the total taxable value of land and additions on the property. | Land | Improvement |
|---|---|---|---|---|
| 2025 | $870 | $66,900 | $0 | $0 |
| 2024 | $4 | $57,600 | $0 | $0 |
| 2023 | $343 | $46,800 | $0 | $0 |
| 2022 | $802 | $42,400 | $0 | $0 |
| 2021 | $797 | $42,000 | $0 | $0 |
| 2020 | $787 | $40,100 | $0 | $0 |
| 2019 | $775 | $37,600 | $0 | $0 |
| 2018 | $793 | $31,100 | $0 | $0 |
| 2017 | $804 | $29,600 | $0 | $0 |
| 2016 | $787 | $28,000 | $0 | $0 |
| 2015 | -- | $27,700 | $0 | $0 |
| 2014 | -- | $26,500 | $0 | $0 |
Source: Public Records
Map
Nearby Homes
- 10201 Mason Dr
- 86 W State Rd
- 151 & 153 Clark St
- 11298 S Gordon Ave
- Lot 19 S Elder Ave
- 2119 W 116th St
- 2308 W 112th St
- 17474 Connor Cir
- 14074 S Elder Ave
- 953 E 136th St
- 12745 Austrian Dr
- 3193 W 112th St
- 1885 Shaw Rd
- 15255 Bailey Rd
- 17090 Kenowa Ave
- 12515 Rosemary Ave
- 3500 Northkent Pine Dr
- 9263 S Ferris Ave
- 4115 W 108th St
- 9310 Benjamin Dr
- 1072 W 128th St
- 996 W 128th St
- 980 W 128th St
- 9450 W 128th St
- 13069 S Mason Dr
- 605 W 128th St
- 12560 S Ferris Ave
- 13016 S Ferris Ave
- 533 W 128th St
- 12605 S Ferris Ave
- 475 W 128th St
- 12955 S Mason Dr
- 13170 S Ferris Ave
- 450 W 128th St
- 12395 Ferris Ave
- 12495 Ferris Ave
- 897 W 136th St
- 1120 W 120th St
- 12813 S Mason Dr
- 12855 S Mason Dr