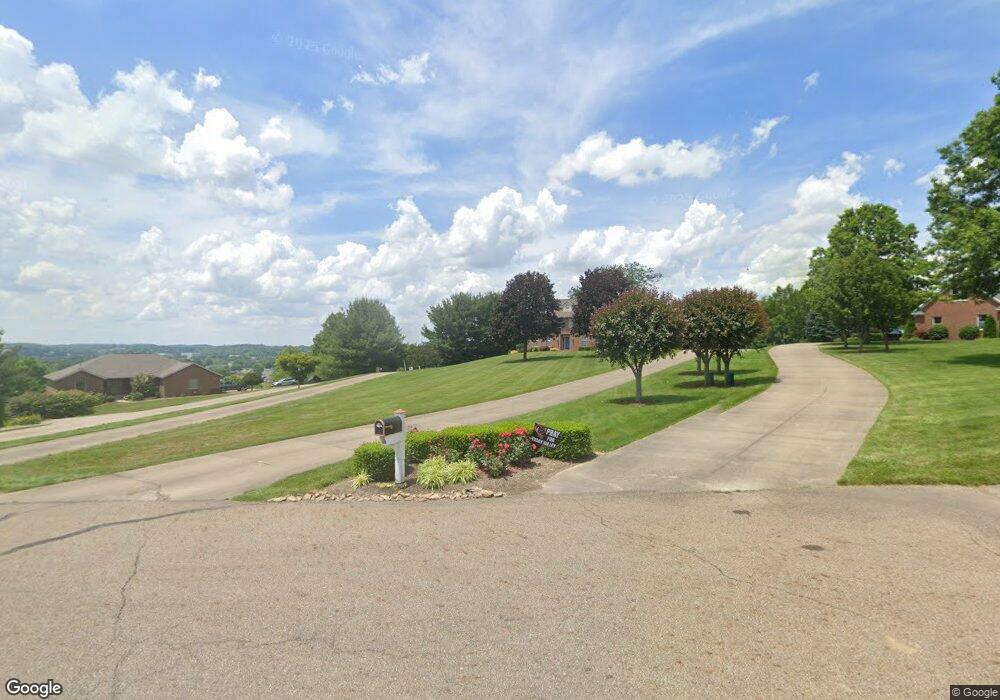
10896 N Laurens Square NE Bolivar, OH 44612
Estimated Value: $380,000 - $480,070
3
Beds
3
Baths
2,852
Sq Ft
$149/Sq Ft
Est. Value
About This Home
This home is located at 10896 N Laurens Square NE, Bolivar, OH 44612 and is currently estimated at $425,268, approximately $149 per square foot. 10896 N Laurens Square NE is a home located in Tuscarawas County with nearby schools including Tuscarawas Valley Primary School, Tuscarawas Valley Intermediate School, and Tuscarawas Valley Middle School.
Ownership History
Date
Name
Owned For
Owner Type
Purchase Details
Closed on
Apr 8, 2005
Sold by
Conaway Carl J and Conaway Phana M
Bought by
Schultz Bill J and Schultz Donna M
Current Estimated Value
Home Financials for this Owner
Home Financials are based on the most recent Mortgage that was taken out on this home.
Original Mortgage
$216,000
Outstanding Balance
$110,958
Interest Rate
5.71%
Mortgage Type
Fannie Mae Freddie Mac
Estimated Equity
$314,310
Purchase Details
Closed on
Apr 14, 2000
Sold by
Thomas John V
Bought by
Conaway Carl J and Conaway Phana M
Home Financials for this Owner
Home Financials are based on the most recent Mortgage that was taken out on this home.
Original Mortgage
$237,500
Interest Rate
7.75%
Mortgage Type
New Conventional
Purchase Details
Closed on
Mar 3, 1994
Bought by
Thomas John and Thomas Jennifer L
Create a Home Valuation Report for This Property
The Home Valuation Report is an in-depth analysis detailing your home's value as well as a comparison with similar homes in the area
Home Values in the Area
Average Home Value in this Area
Purchase History
| Date | Buyer | Sale Price | Title Company |
|---|---|---|---|
| Schultz Bill J | $270,000 | Tusc Title | |
| Conaway Carl J | $250,000 | -- | |
| Thomas John | $32,000 | -- |
Source: Public Records
Mortgage History
| Date | Status | Borrower | Loan Amount |
|---|---|---|---|
| Open | Schultz Bill J | $216,000 | |
| Closed | Conaway Carl J | $237,500 |
Source: Public Records
Tax History Compared to Growth
Tax History
| Year | Tax Paid | Tax Assessment Tax Assessment Total Assessment is a certain percentage of the fair market value that is determined by local assessors to be the total taxable value of land and additions on the property. | Land | Improvement |
|---|---|---|---|---|
| 2024 | $5,867 | $121,960 | $27,640 | $94,320 |
| 2023 | $5,867 | $348,450 | $78,960 | $269,490 |
| 2022 | $5,812 | $121,958 | $27,636 | $94,322 |
| 2021 | $5,631 | $112,701 | $26,506 | $86,195 |
| 2020 | $5,632 | $112,701 | $26,506 | $86,195 |
| 2019 | $5,707 | $120,758 | $26,506 | $94,252 |
| 2018 | $5,100 | $101,910 | $22,370 | $79,540 |
| 2017 | $5,146 | $101,910 | $22,370 | $79,540 |
| 2016 | $5,108 | $101,910 | $22,370 | $79,540 |
| 2014 | $4,806 | $90,140 | $20,340 | $69,800 |
| 2013 | $3,926 | $90,140 | $20,340 | $69,800 |
Source: Public Records
Map
Nearby Homes
- 827 Melissa St NE
- 0 Kerns Dr NE
- 10988 Madlyn St NE
- 10952 Madlyn St NE
- 720 Holly St NE
- 10884 Madlyn St NE
- 11275 Indian Hills Dr NE
- 10419 Laurens Dr NE
- 11162 Northwood Ave NE
- 11167 Northwood Ave NE
- 1517 NE North Orchard Rd
- 1557 N Orchard Rd NE
- 379 Olde Orchard Dr NE
- 1678 N Orchard Rd NE
- 1750 N Orchard Rd NE
- 0 State Route 212 Unit 4441887
- VL Hess Mill Rd NE
- 9738 Kennett Square NE
- 1001 Mill Circle Dr NE
- 12239 Sherman Church Rd NE
- 10878 N Laurens Square NE
- 10892 N Laurens Square NE
- 10874 N Laurens Square NE
- 10864 N Laurens Square NE
- 10840 N Laurens Square NE
- 10816 N Laurens Square NE
- 10869 N Laurens Square NE
- 10903 State Route 212 NE
- 10809 N Laurens Square NE
- 10710 Laurens Dr NE
- 892 N Orchard Rd NE
- 944 N Orchard Rd NE
- 10780 N Laurens Square NE
- 10696 Laurens Dr NE
- 10777 N Laurens Square NE
- 10707 Laurens Dr NE
- 10794 N Laurens Square NE
- 10770 N Laurens Square NE
- 10672 Laurens Dr NE
- 10758 N Laurens Square NE