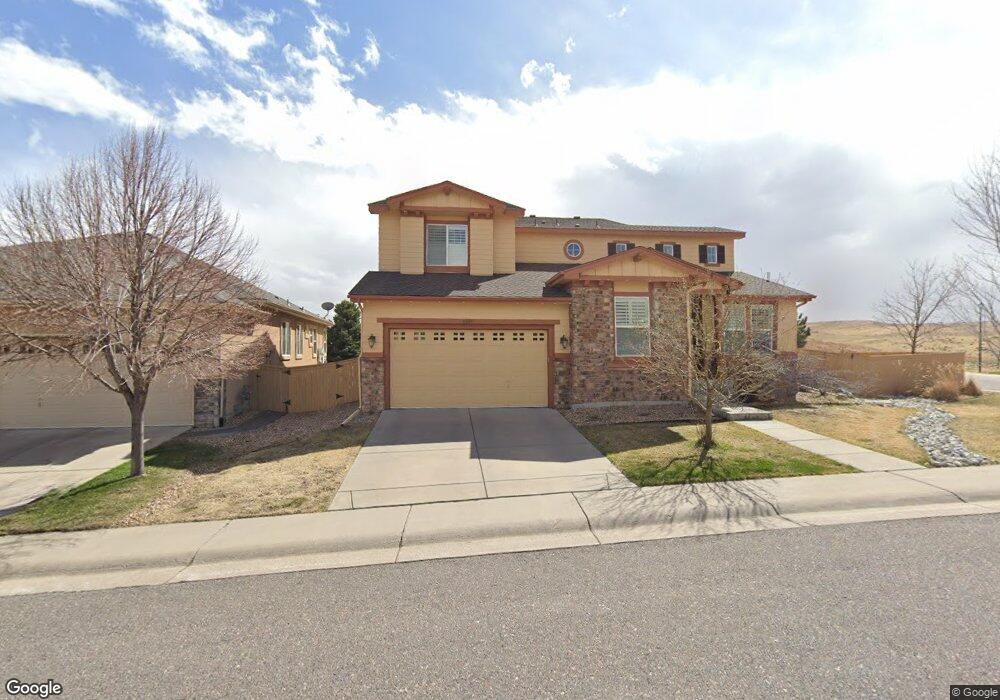
10897 Glengate Cir Highlands Ranch, CO 80130
Southridge NeighborhoodEstimated Value: $1,072,459 - $1,212,000
4
Beds
3
Baths
5,406
Sq Ft
$210/Sq Ft
Est. Value
About This Home
This home is located at 10897 Glengate Cir, Highlands Ranch, CO 80130 and is currently estimated at $1,135,615, approximately $210 per square foot. 10897 Glengate Cir is a home located in Douglas County with nearby schools including Wildcat Mountain Elementary School, Rocky Heights Middle School, and Rock Canyon High School.
Ownership History
Date
Name
Owned For
Owner Type
Purchase Details
Closed on
Sep 20, 2016
Sold by
Mahajan Amandeep and Mahajan Chetna
Bought by
Akerman Lee Darren and Akerman Amy Belinda
Current Estimated Value
Home Financials for this Owner
Home Financials are based on the most recent Mortgage that was taken out on this home.
Original Mortgage
$527,000
Outstanding Balance
$421,218
Interest Rate
3.45%
Mortgage Type
New Conventional
Estimated Equity
$714,397
Purchase Details
Closed on
Oct 16, 2006
Sold by
Shea Homes Lp
Bought by
Mahajan Amandeep and Mahajan Chetna
Home Financials for this Owner
Home Financials are based on the most recent Mortgage that was taken out on this home.
Original Mortgage
$472,600
Interest Rate
6.41%
Mortgage Type
Unknown
Create a Home Valuation Report for This Property
The Home Valuation Report is an in-depth analysis detailing your home's value as well as a comparison with similar homes in the area
Home Values in the Area
Average Home Value in this Area
Purchase History
| Date | Buyer | Sale Price | Title Company |
|---|---|---|---|
| Akerman Lee Darren | $677,000 | North American Title | |
| Mahajan Amandeep | $590,792 | Fahtco |
Source: Public Records
Mortgage History
| Date | Status | Borrower | Loan Amount |
|---|---|---|---|
| Open | Akerman Lee Darren | $527,000 | |
| Previous Owner | Mahajan Amandeep | $472,600 |
Source: Public Records
Tax History Compared to Growth
Tax History
| Year | Tax Paid | Tax Assessment Tax Assessment Total Assessment is a certain percentage of the fair market value that is determined by local assessors to be the total taxable value of land and additions on the property. | Land | Improvement |
|---|---|---|---|---|
| 2024 | $7,268 | $80,800 | $13,910 | $66,890 |
| 2023 | $7,255 | $80,800 | $13,910 | $66,890 |
| 2022 | $4,944 | $54,110 | $10,110 | $44,000 |
| 2021 | $5,142 | $54,110 | $10,110 | $44,000 |
| 2020 | $4,754 | $51,260 | $10,120 | $41,140 |
| 2019 | $4,772 | $51,260 | $10,120 | $41,140 |
| 2018 | $4,617 | $48,850 | $9,810 | $39,040 |
| 2017 | $4,204 | $48,850 | $9,810 | $39,040 |
| 2016 | $4,384 | $50,000 | $9,750 | $40,250 |
| 2015 | $4,478 | $50,000 | $9,750 | $40,250 |
| 2014 | $4,239 | $43,700 | $7,960 | $35,740 |
Source: Public Records
Map
Nearby Homes
- 10881 Glengate Cir
- 11074 Grayledge Cir
- 4821 Bluegate Dr
- 11036 Glengate Cir
- 5300 Fullerton Ln
- 4965 Huntwick Place
- 10896 Valleybrook Cir
- 10994 Shadowbrook Cir
- 10832 Hickory Ridge Ln
- 10754 Towerbridge Cir
- 10653 Briarglen Cir
- 10645 Cedarcrest Cir
- 10660 Jewelberry Cir
- 10547 Laurelglen Cir
- 5001 Laurelglen Ln
- 10497 Wagon Box Cir
- 4656 Ketchwood Cir
- 10580 Parkington Ln Unit B
- 6042 Sima Cir
- 10753 Cedar Brook Ln
- 10899 Glengate Cir
- 10903 Glengate Cir
- 11100 Grayledge Cir
- 10898 Glengate Cir
- 10894 Glengate Cir
- 10902 Glengate Cir
- 10890 Glengate Cir
- 10905 Glengate Cir
- 11090 Grayledge Cir
- 10906 Glengate Cir
- 10885 Glengate Cir
- 10886 Glengate Cir
- 10909 Glengate Cir
- 4790 Bluegate Dr
- 4784 Bluegate Dr
- 4796 Bluegate Dr
- 11082 Grayledge Cir
- 10910 Glengate Cir
- 4778 Bluegate Dr
- 10882 Glengate Cir