Estimated Value: $199,000 - $231,000
--
Bed
--
Bath
--
Sq Ft
4,922
Sq Ft Lot
About This Home
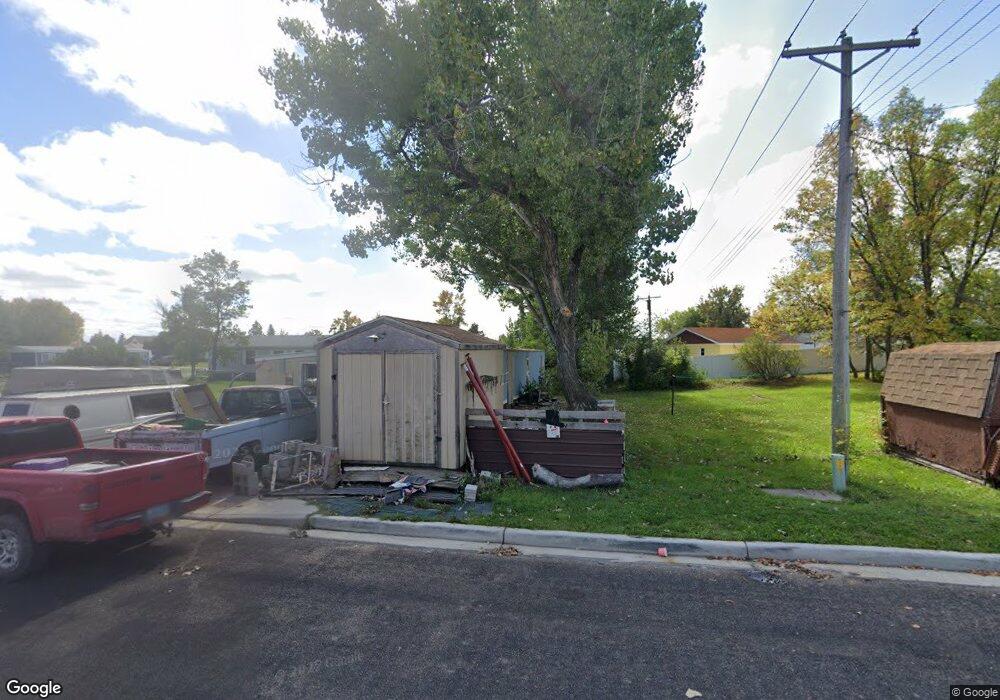
This home is located at 109 4th St NE, Tioga, ND 58852 and is currently estimated at $214,242. 109 4th St NE is a home with nearby schools including Central Elementary School and Tioga High School.
Ownership History
Date
Name
Owned For
Owner Type
Purchase Details
Closed on
Aug 12, 2019
Sold by
Wolla Chester E and Wolla Jason Dean
Bought by
Wolla Chester E and Wolla Ricky Dean
Current Estimated Value
Purchase Details
Closed on
Nov 13, 2017
Sold by
Stewart Rose M
Bought by
Johnsrud Susan and Fredrickson Steven
Purchase Details
Closed on
Aug 15, 2017
Sold by
Riedl Diane and Riedl Kenneth L
Bought by
Janecek Sean J and Palladino Janecek Anne
Purchase Details
Closed on
Feb 24, 2015
Sold by
Wolla Chester E
Bought by
Wolla Chester E and Wolla Jason Dean
Purchase Details
Closed on
Mar 11, 2013
Sold by
Bottoms Horace Eugene and Bottoms Dale Marie
Bought by
Riedl Diane
Purchase Details
Closed on
Nov 2, 2011
Sold by
County Of Williams
Bought by
Shuey Rick
Purchase Details
Closed on
Oct 22, 2010
Sold by
Strahan Ella F
Bought by
Bottoms Horace Eugene and Bottoms Dale Marie
Purchase Details
Closed on
Aug 25, 2010
Sold by
Miller Kenneth R and Miller Kenneth
Bought by
Longie Louis M and Longie Carol I
Create a Home Valuation Report for This Property
The Home Valuation Report is an in-depth analysis detailing your home's value as well as a comparison with similar homes in the area
Home Values in the Area
Average Home Value in this Area
Purchase History
| Date | Buyer | Sale Price | Title Company |
|---|---|---|---|
| Wolla Chester E | -- | None Available | |
| Johnsrud Susan | -- | None Available | |
| Janecek Sean J | $160,000 | None Available | |
| Wolla Chester E | -- | None Available | |
| Riedl Diane | $155,000 | None Available | |
| Shuey Rick | $645 | None Available | |
| Bottoms Horace Eugene | $114,000 | None Available | |
| Longie Louis M | $65,000 | None Available |
Source: Public Records
Tax History Compared to Growth
Tax History
| Year | Tax Paid | Tax Assessment Tax Assessment Total Assessment is a certain percentage of the fair market value that is determined by local assessors to be the total taxable value of land and additions on the property. | Land | Improvement |
|---|---|---|---|---|
| 2024 | $380 | $24,390 | $5,500 | $18,890 |
| 2023 | $335 | $22,645 | $0 | $0 |
| 2022 | $297 | $26,342 | $0 | $0 |
| 2021 | $295 | $19,395 | $5,500 | $13,895 |
| 2020 | $280 | $22,100 | $5,500 | $16,600 |
| 2019 | $345 | $26,100 | $5,500 | $20,600 |
| 2018 | $331 | $25,350 | $5,500 | $19,850 |
| 2017 | $296 | $22,800 | $5,500 | $17,300 |
| 2016 | $400 | $35,750 | $5,500 | $30,250 |
| 2012 | -- | $7,900 | $2,000 | $5,900 |
Source: Public Records
Map
Nearby Homes
- 414 N Main St
- 118 4th St NW
- 502 Willard Blvd
- 410 Dean Ave
- 102 14th St Unit Block 52 Lot 1
- 140 14th St Unit Block 52 Lot 2
- 251 14th St Unit Block 35 Lot 1
- 275 14th St Unit Block 35 Lot 2
- 180 14th St Unit Block 52 lot 5
- 301 14th St Unit Block 35 Lot 3
- 325 14th St Unit Block 35 Lot 4
- 351 14th St Unit Block 35 Lot 5
- 351 14th St
- 375 14th St Unit Block 35 Lot 6
- 425 14th St Unit Block 35 Lot 8
- 451 14th St Unit Block 35 Lot 9
- 240 14th St Unit Block 52 Lot 8
- 280 14th St Unit Block 52 Lot 10
- 302 14th St Unit Block 52 Lot 12
- 410 14th St NE