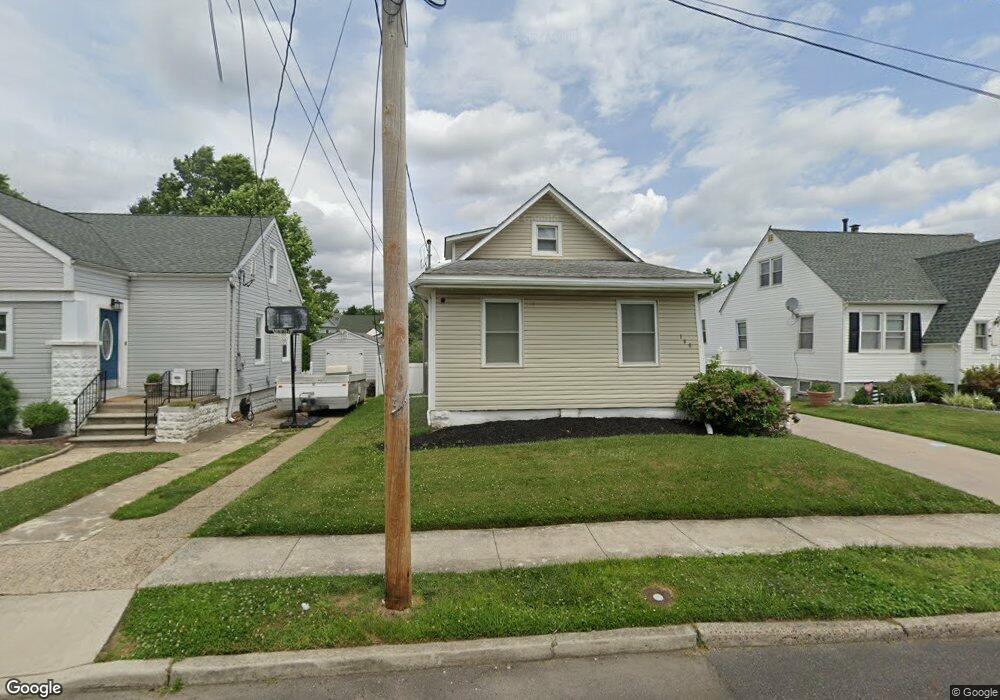
109 5th Ave Mount Ephraim, NJ 08059
Estimated Value: $292,905 - $331,000
--
Bed
--
Bath
1,256
Sq Ft
$247/Sq Ft
Est. Value
About This Home
This home is located at 109 5th Ave, Mount Ephraim, NJ 08059 and is currently estimated at $310,726, approximately $247 per square foot. 109 5th Ave is a home located in Camden County with nearby schools including Mary Bray Elementary School, Raymond W. Kershaw Elementary School, and Brookfield Elementary School.
Ownership History
Date
Name
Owned For
Owner Type
Purchase Details
Closed on
Oct 12, 2018
Sold by
Oliver Karem M
Bought by
Oliver Christopher M
Current Estimated Value
Purchase Details
Closed on
Jan 24, 2008
Sold by
Lebb Robert W and Lebb Jeffrey W
Bought by
Oliver Christopher M
Home Financials for this Owner
Home Financials are based on the most recent Mortgage that was taken out on this home.
Original Mortgage
$174,800
Outstanding Balance
$110,567
Interest Rate
6.2%
Mortgage Type
New Conventional
Estimated Equity
$200,159
Purchase Details
Closed on
Jun 9, 2006
Sold by
Piontowski Mark
Bought by
Lebb Robert W and Lebb Jeffrey W
Home Financials for this Owner
Home Financials are based on the most recent Mortgage that was taken out on this home.
Original Mortgage
$192,479
Interest Rate
6.71%
Mortgage Type
FHA
Purchase Details
Closed on
Aug 15, 2005
Sold by
Fuhrman Robert F
Bought by
Piontkowski Mark
Create a Home Valuation Report for This Property
The Home Valuation Report is an in-depth analysis detailing your home's value as well as a comparison with similar homes in the area
Home Values in the Area
Average Home Value in this Area
Purchase History
| Date | Buyer | Sale Price | Title Company |
|---|---|---|---|
| Oliver Christopher M | -- | None Available | |
| Oliver Christopher M | $184,000 | -- | |
| Lebb Robert W | $196,000 | -- | |
| Piontkowski Mark | $57,193 | -- |
Source: Public Records
Mortgage History
| Date | Status | Borrower | Loan Amount |
|---|---|---|---|
| Open | Oliver Christopher M | $174,800 | |
| Previous Owner | Lebb Robert W | $192,479 |
Source: Public Records
Tax History Compared to Growth
Tax History
| Year | Tax Paid | Tax Assessment Tax Assessment Total Assessment is a certain percentage of the fair market value that is determined by local assessors to be the total taxable value of land and additions on the property. | Land | Improvement |
|---|---|---|---|---|
| 2025 | $7,153 | $136,900 | $39,500 | $97,400 |
| 2024 | $7,059 | $136,900 | $39,500 | $97,400 |
| 2023 | $7,059 | $136,900 | $39,500 | $97,400 |
| 2022 | $6,868 | $136,900 | $39,500 | $97,400 |
| 2021 | $6,677 | $136,900 | $39,500 | $97,400 |
| 2020 | $6,496 | $136,900 | $39,500 | $97,400 |
| 2019 | $6,378 | $136,900 | $39,500 | $97,400 |
| 2018 | $6,322 | $136,900 | $39,500 | $97,400 |
| 2017 | $6,229 | $136,900 | $39,500 | $97,400 |
| 2016 | $6,033 | $136,900 | $39,500 | $97,400 |
| 2015 | $5,825 | $136,900 | $39,500 | $97,400 |
| 2014 | $5,502 | $81,600 | $25,000 | $56,600 |
Source: Public Records
Map
Nearby Homes