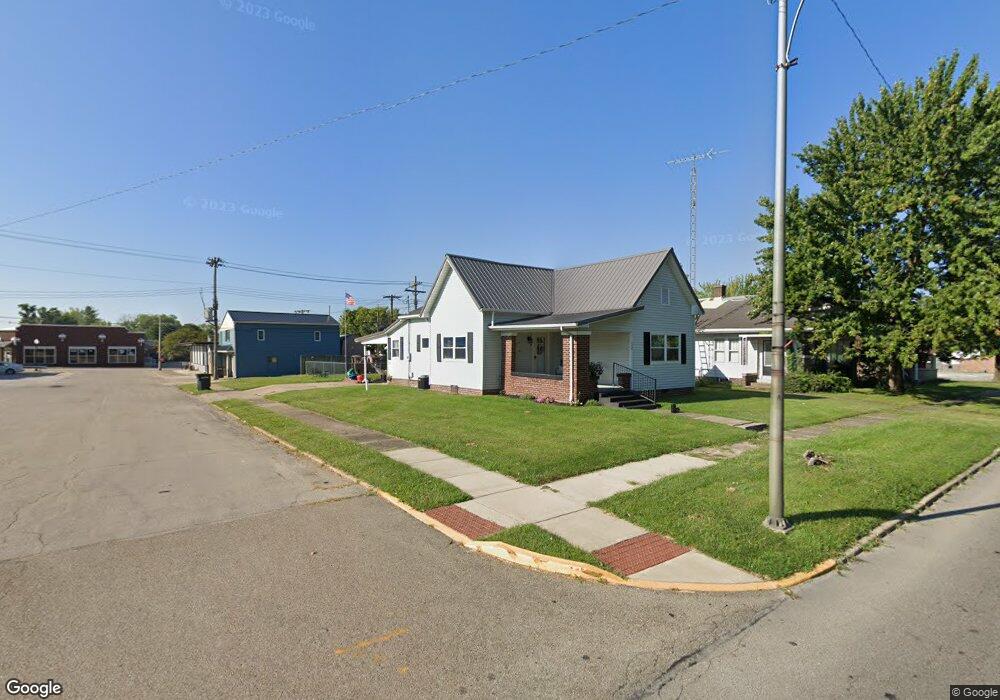
109 A St SE Linton, IN 47441
Estimated Value: $154,321 - $200,000
--
Bed
1
Bath
2,768
Sq Ft
$65/Sq Ft
Est. Value
About This Home
This home is located at 109 A St SE, Linton, IN 47441 and is currently estimated at $179,580, approximately $64 per square foot. 109 A St SE is a home located in Greene County with nearby schools including Linton-Stockton Elementary School, Linton-Stockton Junior High School, and Linton-Stockton High School.
Ownership History
Date
Name
Owned For
Owner Type
Purchase Details
Closed on
Jul 29, 2014
Sold by
Crane Fedl Cu
Bought by
Kenwothy Amy J
Current Estimated Value
Home Financials for this Owner
Home Financials are based on the most recent Mortgage that was taken out on this home.
Original Mortgage
$48,760
Outstanding Balance
$37,179
Interest Rate
4.11%
Mortgage Type
New Conventional
Estimated Equity
$142,401
Purchase Details
Closed on
Apr 9, 2013
Sold by
Brown Michael R
Bought by
Crane Federal Cu
Create a Home Valuation Report for This Property
The Home Valuation Report is an in-depth analysis detailing your home's value as well as a comparison with similar homes in the area
Home Values in the Area
Average Home Value in this Area
Purchase History
| Date | Buyer | Sale Price | Title Company |
|---|---|---|---|
| Kenwothy Amy J | -- | Crane Title | |
| Crane Federal Cu | -- | Crane Title Llc |
Source: Public Records
Mortgage History
| Date | Status | Borrower | Loan Amount |
|---|---|---|---|
| Open | Kenwothy Amy J | $48,760 |
Source: Public Records
Tax History Compared to Growth
Tax History
| Year | Tax Paid | Tax Assessment Tax Assessment Total Assessment is a certain percentage of the fair market value that is determined by local assessors to be the total taxable value of land and additions on the property. | Land | Improvement |
|---|---|---|---|---|
| 2024 | $795 | $76,700 | $9,100 | $67,600 |
| 2023 | $763 | $75,900 | $9,100 | $66,800 |
| 2022 | $797 | $78,100 | $9,100 | $69,000 |
| 2021 | $752 | $72,400 | $9,100 | $63,300 |
| 2020 | $767 | $74,500 | $9,100 | $65,400 |
| 2019 | $743 | $71,500 | $9,100 | $62,400 |
| 2018 | $689 | $66,100 | $9,100 | $57,000 |
| 2017 | $732 | $71,500 | $9,100 | $62,400 |
| 2016 | $692 | $71,200 | $9,100 | $62,100 |
| 2014 | $632 | $70,900 | $9,100 | $61,800 |
| 2013 | -- | $70,200 | $9,100 | $61,100 |
Source: Public Records
Map
Nearby Homes