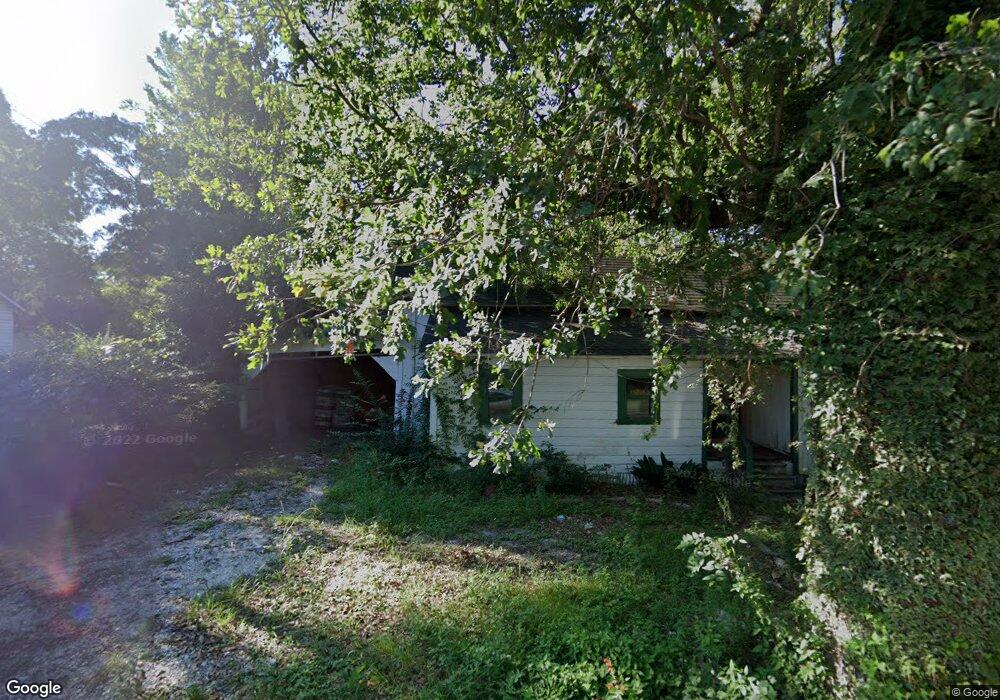
109 Anderson St Lufkin, TX 75904
Estimated Value: $62,000
4
Beds
2
Baths
1,232
Sq Ft
$50/Sq Ft
Est. Value
About This Home
This home is located at 109 Anderson St, Lufkin, TX 75904 and is currently priced at $62,000, approximately $50 per square foot. 109 Anderson St is a home located in Angelina County with nearby schools including Trout Primary School, Brookhollow Elementary School, and Lufkin Middle School.
Ownership History
Date
Name
Owned For
Owner Type
Purchase Details
Closed on
Jan 17, 2023
Sold by
Busby Pamela
Bought by
Oak Bridge Investment Group Llc
Current Estimated Value
Purchase Details
Closed on
Jan 20, 2022
Sold by
Ann Busby Pamela
Bought by
Putman Frances J
Purchase Details
Closed on
Sep 14, 2015
Sold by
Malnar Jackie Marie Smith
Bought by
Malnar Roy Lee
Create a Home Valuation Report for This Property
The Home Valuation Report is an in-depth analysis detailing your home's value as well as a comparison with similar homes in the area
Home Values in the Area
Average Home Value in this Area
Purchase History
| Date | Buyer | Sale Price | Title Company |
|---|---|---|---|
| Oak Bridge Investment Group Llc | -- | Blueprint Title | |
| Putman Frances J | -- | Deaton Law Firm | |
| Malnar Roy Lee | -- | None Available |
Source: Public Records
Tax History Compared to Growth
Tax History
| Year | Tax Paid | Tax Assessment Tax Assessment Total Assessment is a certain percentage of the fair market value that is determined by local assessors to be the total taxable value of land and additions on the property. | Land | Improvement |
|---|---|---|---|---|
| 2023 | $1,228 | $61,810 | $11,700 | $50,110 |
| 2022 | $773 | $49,850 | $4,870 | $44,980 |
| 2021 | $760 | $45,910 | $4,870 | $41,040 |
| 2020 | $689 | $28,040 | $3,820 | $24,220 |
| 2019 | $731 | $28,140 | $3,820 | $24,320 |
| 2018 | $9 | $27,440 | $3,820 | $23,620 |
| 2017 | $9 | $26,570 | $3,820 | $22,750 |
| 2016 | $627 | $26,300 | $3,820 | $22,480 |
| 2015 | $17 | $37,790 | $3,820 | $33,970 |
| 2014 | $17 | $35,670 | $3,820 | $31,850 |
Source: Public Records
Map
Nearby Homes
- 104 Peggy Ln
- 310 Brock St
- 4000 Ellen Trout Dr
- 2510 Jimmie St
- Lot 8 Minnie Lou St
- Lot 12 Minnie Lou St
- Lot 7 Minnie Lou St
- Lot 10 Minnie Lou St
- Lot 11 Minnie Lou St
- Lot 9 Minnie Lou St
- 2508 U S 69
- 5003 Lotus Ln
- PID 153712 Lotus Ln
- 2015, 2013 Culverhouse St
- 5206 Lotus Ln
- 1316 N Raguet St
- 1702 Williams St
- 1306 N Raguet St
- TBD Kurth Dr
- 0 Kurth Dr