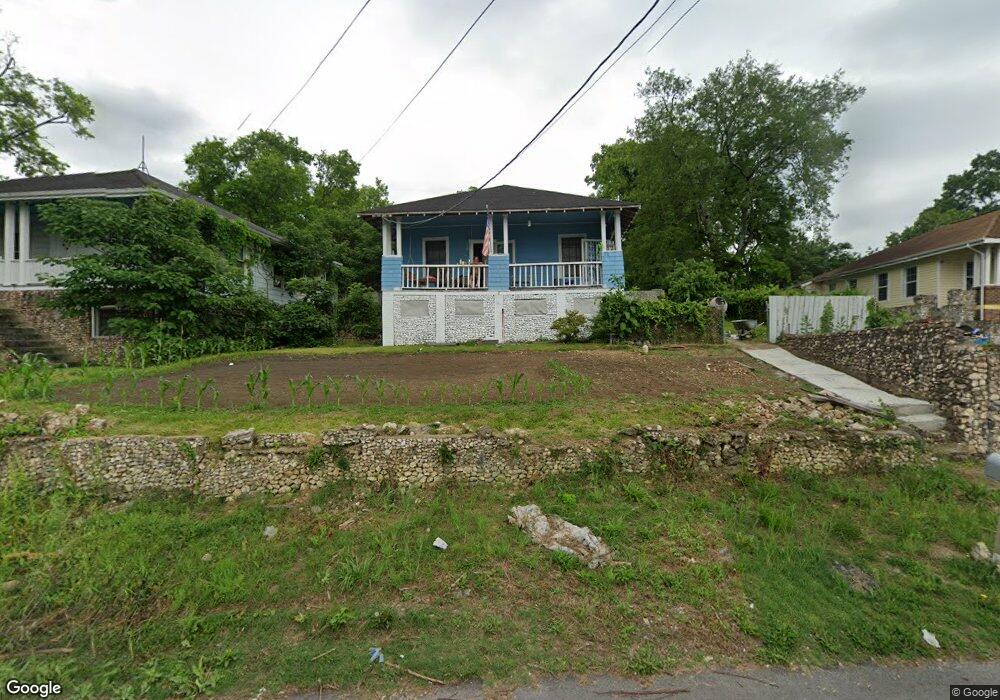
109 Andrews St Rossville, GA 30741
Estimated Value: $136,622 - $167,000
--
Bed
1
Bath
1,051
Sq Ft
$148/Sq Ft
Est. Value
About This Home
This home is located at 109 Andrews St, Rossville, GA 30741 and is currently estimated at $155,906, approximately $148 per square foot. 109 Andrews St is a home located in Walker County with nearby schools including Rossville Elementary School, Rossville Middle School, and Ridgeland High School.
Ownership History
Date
Name
Owned For
Owner Type
Purchase Details
Closed on
Aug 27, 2003
Sold by
Leming Evelyn L and Linda Joyce
Bought by
Leming Evelyn L and Linda Joyce
Current Estimated Value
Purchase Details
Closed on
Jan 20, 1995
Sold by
Radcliff Michael D and Radcliff Karen
Bought by
Leming Evelyn L
Purchase Details
Closed on
Oct 3, 1986
Sold by
Larsen Robert and Wf Karen
Bought by
Radcliff Michael D and Radcliff Karen
Purchase Details
Closed on
Aug 26, 1983
Sold by
Smith Iona Caldwell
Bought by
Larsen Robert and Wf Karen
Purchase Details
Closed on
Jun 1, 1982
Sold by
Campbell Tommy R and Wf Shirley
Bought by
Smith Iona Caldwell
Purchase Details
Closed on
Nov 1, 1981
Sold by
Cameron Kenneth W
Bought by
Campbell Tommy R and Wf Shirley
Purchase Details
Closed on
Nov 9, 1976
Sold by
Cameron Edgar L
Bought by
Cameron Kenneth W
Purchase Details
Closed on
Jul 29, 1976
Bought by
Cameron Edgar L
Create a Home Valuation Report for This Property
The Home Valuation Report is an in-depth analysis detailing your home's value as well as a comparison with similar homes in the area
Home Values in the Area
Average Home Value in this Area
Purchase History
| Date | Buyer | Sale Price | Title Company |
|---|---|---|---|
| Leming Evelyn L | -- | -- | |
| Leming Evelyn L | -- | -- | |
| Radcliff Michael D | -- | -- | |
| Larsen Robert | -- | -- | |
| Smith Iona Caldwell | $22,500 | -- | |
| Campbell Tommy R | $12,000 | -- | |
| Cameron Kenneth W | -- | -- | |
| Cameron Edgar L | -- | -- |
Source: Public Records
Tax History Compared to Growth
Tax History
| Year | Tax Paid | Tax Assessment Tax Assessment Total Assessment is a certain percentage of the fair market value that is determined by local assessors to be the total taxable value of land and additions on the property. | Land | Improvement |
|---|---|---|---|---|
| 2024 | $471 | $44,283 | $3,939 | $40,344 |
| 2023 | $448 | $42,120 | $3,939 | $38,181 |
| 2022 | $1,281 | $34,362 | $2,626 | $31,736 |
| 2021 | $910 | $22,554 | $2,626 | $19,928 |
| 2020 | $210 | $19,174 | $2,608 | $16,566 |
| 2019 | $799 | $19,174 | $2,608 | $16,566 |
| 2018 | $67 | $19,174 | $2,608 | $16,566 |
| 2017 | $67 | $19,174 | $2,608 | $16,566 |
| 2016 | $474 | $12,494 | $2,608 | $9,886 |
| 2015 | -- | $23,369 | $2,616 | $20,753 |
| 2014 | -- | $23,369 | $2,616 | $20,753 |
| 2013 | -- | $23,368 | $2,616 | $20,752 |
Source: Public Records
Map
Nearby Homes
- 301 Dempsey Ln
- 0 Dempsey Ln Unit 1504691
- 115 Beech St
- 3312 E 51st St
- 1515 E 50th St
- 39 Clift Trail
- 302 E Gordon Ave
- 4908 13th Ave
- 4807 14th Ave
- 4900 15th Ave
- 0 S Mission Ridge Dr Unit 1504695
- 0 Clift Trail Unit 1502212
- 71 Georgia Terrace
- 806 Mcfarland Ave
- 1410 E 50th St
- 509 W Gordon Ave
- 1614 E 47th St
- 141 Hogan Rd
- 189 Leinbach Rd
- 1403 E 49th St
- 113 Andrews St
- 105 Andrews St
- 201 Richmond Ave
- 112 Wilson St
- 110 Wilson St
- 114 Wilson St
- 120 Wilson St
- 106 Wilson St
- 306 Mcfarland Ave
- 304 Mcfarland Ave
- 201 Andrews St
- 218 Mcfarland Ave
- 200 Wilson St
- 303 Mcfarland Ave
- 202 Wilson St
- 113 Wilson St
- 109 Wilson St
- 109 Wilson St
- 115 Wilson St
- 203 Andrews St