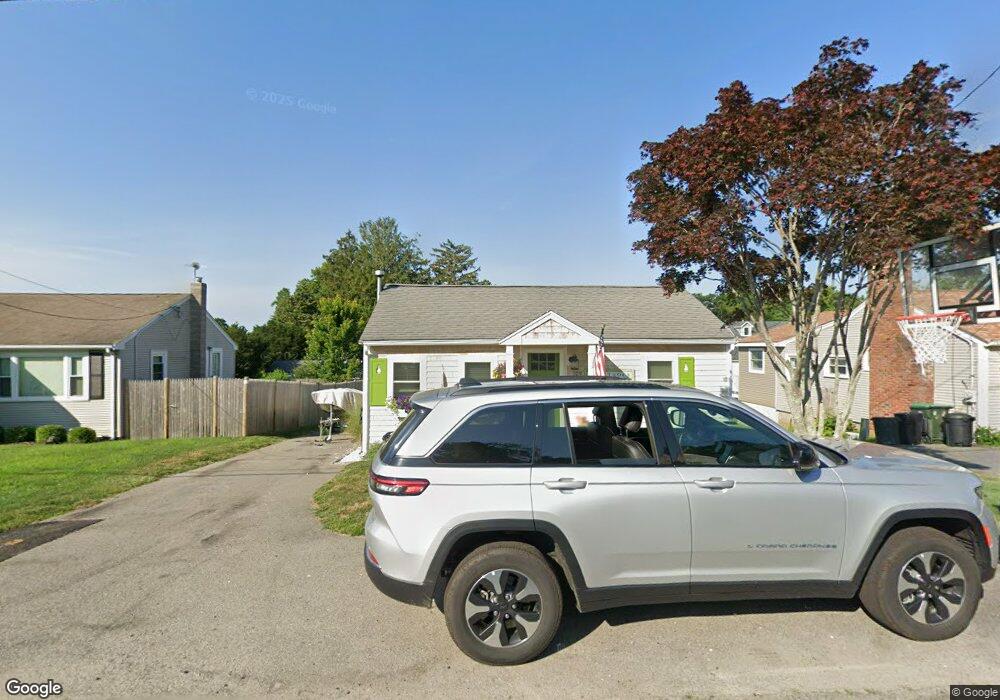
109 Arnold Rd Marshfield, MA 02050
Ocean Bluff-Brant Rock NeighborhoodEstimated Value: $522,000 - $543,000
2
Beds
1
Bath
884
Sq Ft
$600/Sq Ft
Est. Value
About This Home
This home is located at 109 Arnold Rd, Marshfield, MA 02050 and is currently estimated at $530,112, approximately $599 per square foot. 109 Arnold Rd is a home located in Plymouth County with nearby schools including Governor Edward Winslow School, Furnace Brook Middle School, and Marshfield High School.
Ownership History
Date
Name
Owned For
Owner Type
Purchase Details
Closed on
Jun 10, 2010
Sold by
Mahoney Michael T and Mahoney Carol Ann
Bought by
Mahoney Michael T
Current Estimated Value
Home Financials for this Owner
Home Financials are based on the most recent Mortgage that was taken out on this home.
Original Mortgage
$223,350
Outstanding Balance
$150,142
Interest Rate
5.11%
Mortgage Type
FHA
Estimated Equity
$379,970
Purchase Details
Closed on
Mar 31, 2009
Sold by
Smith Marie
Bought by
Mahoney Michael T and Reynolds Carol Ann
Purchase Details
Closed on
Mar 13, 2007
Sold by
Laverty Bernard J and Laverty Patricia M
Bought by
Smith Marie and Smith Jason
Purchase Details
Closed on
Sep 26, 2002
Sold by
Griffin William E and Griffin Marie S
Bought by
Cb Rt
Create a Home Valuation Report for This Property
The Home Valuation Report is an in-depth analysis detailing your home's value as well as a comparison with similar homes in the area
Home Values in the Area
Average Home Value in this Area
Purchase History
| Date | Buyer | Sale Price | Title Company |
|---|---|---|---|
| Mahoney Michael T | -- | -- | |
| Mahoney Michael T | -- | -- | |
| Mahoney Michael T | -- | -- | |
| Mahoney Michael T | $213,000 | -- | |
| Mahoney Michael T | $213,000 | -- | |
| Smith Marie | $188,000 | -- | |
| Smith Marie | $188,000 | -- | |
| Cb Rt | $220,000 | -- | |
| Cb Rt | $220,000 | -- |
Source: Public Records
Mortgage History
| Date | Status | Borrower | Loan Amount |
|---|---|---|---|
| Open | Mahoney Michael T | $223,350 | |
| Closed | Cb Rt | $223,350 |
Source: Public Records
Tax History
| Year | Tax Paid | Tax Assessment Tax Assessment Total Assessment is a certain percentage of the fair market value that is determined by local assessors to be the total taxable value of land and additions on the property. | Land | Improvement |
|---|---|---|---|---|
| 2025 | $4,657 | $470,400 | $317,600 | $152,800 |
| 2024 | $4,479 | $431,100 | $297,800 | $133,300 |
| 2023 | $4,261 | $389,000 | $268,000 | $121,000 |
| 2022 | $4,261 | $329,000 | $228,300 | $100,700 |
| 2021 | $4,102 | $311,000 | $218,400 | $92,600 |
| 2020 | $3,724 | $279,400 | $188,600 | $90,800 |
| 2019 | $3,606 | $269,500 | $188,600 | $80,900 |
| 2018 | $3,567 | $266,800 | $188,600 | $78,200 |
| 2017 | $3,422 | $249,400 | $178,700 | $70,700 |
| 2016 | $3,223 | $232,200 | $168,700 | $63,500 |
| 2015 | $3,013 | $226,700 | $168,700 | $58,000 |
| 2014 | $3,014 | $226,800 | $168,700 | $58,100 |
Source: Public Records
Map
Nearby Homes
Your Personal Tour Guide
Ask me questions while you tour the home.